As I’ve previously discussed, I’m working with a dataset combining page-level word counts I am just now beginning to explore using HathiTrust Data Capsules to access full-text. I’m quite late to this party, but they seem kinda awesome. from HathiTrust with the At the Circulating Library bibliography to investigate the three-volume novel as something like a publishing platform. In the course of that investigation I encountered a minor data mystery; this post summarizes it. Spoiler: after 1880 three-volume novels included more advertising—or, more precisely, particular publishers did (Chatto and Windus especially). These pages of advertisement contribute noise to analysis of these texts and should probably be removed for most types of analysis.
Clustering the Three-Volume Novel
It took me a while to convince myself of this conclusion, however, and this post records that process of self-persuasion. Let’s start with this image: You can get larger versions of the plots on this page by right-clicking and opening the image in a new tab.
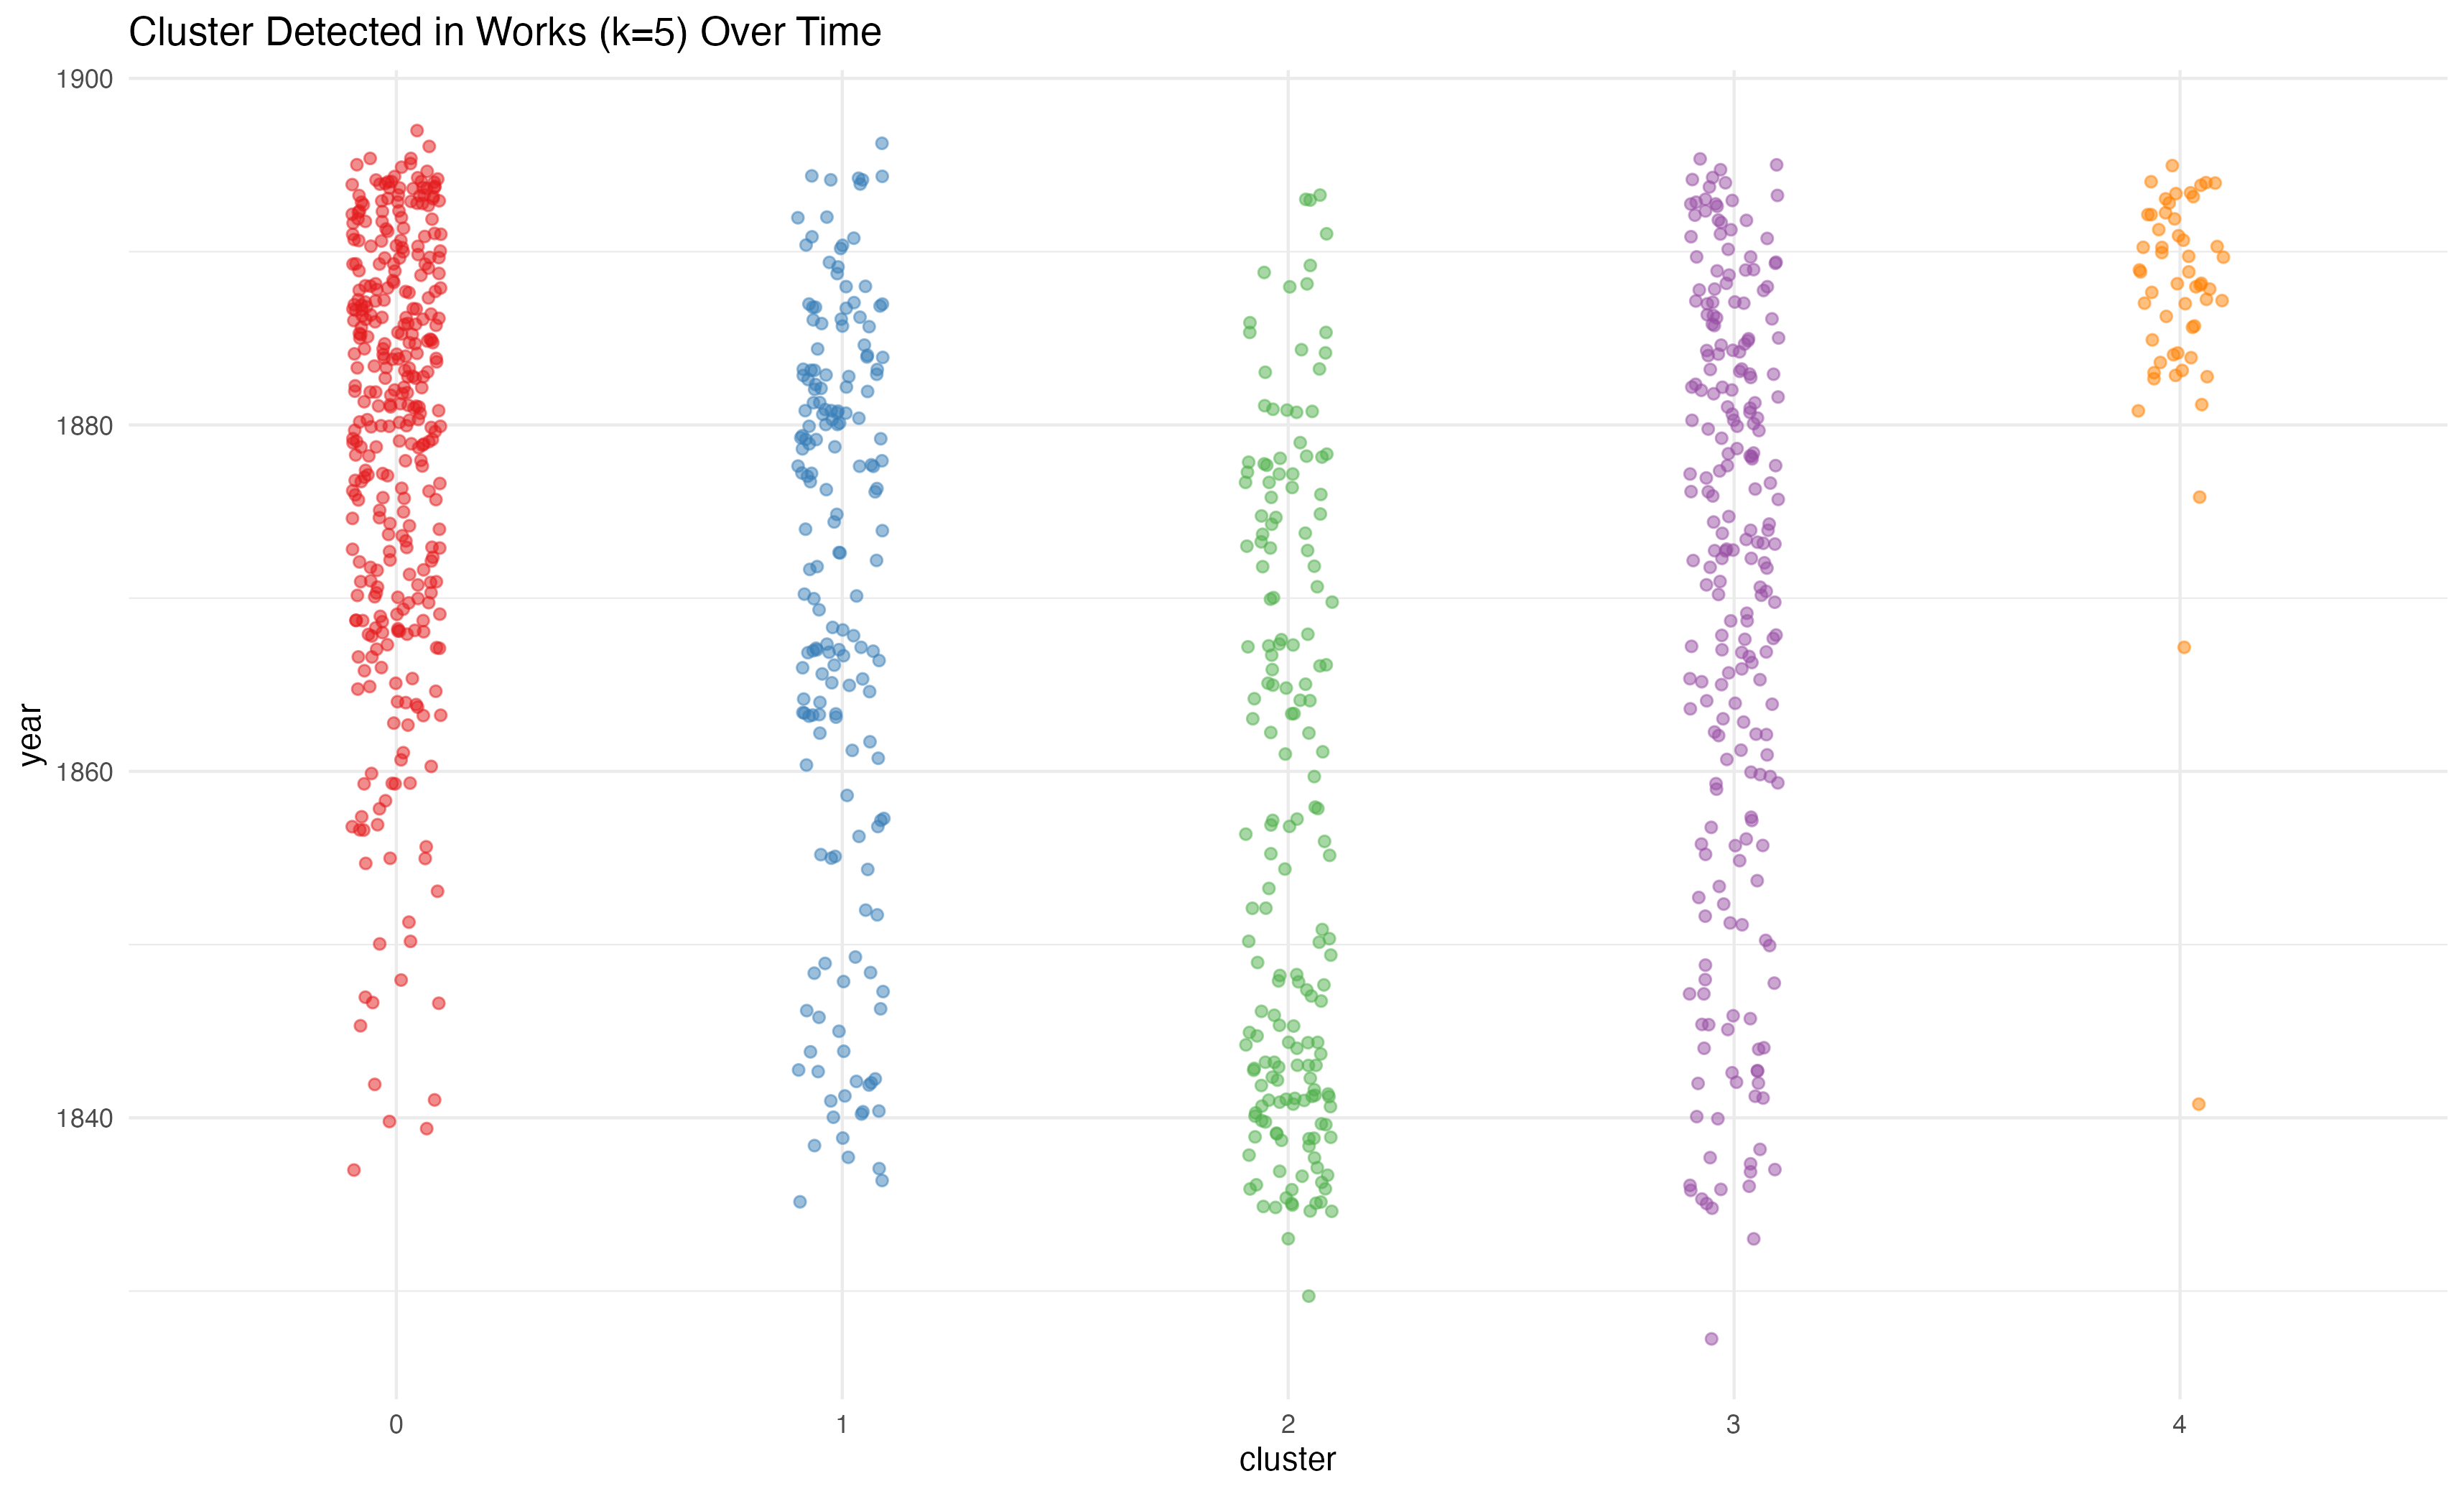
This graph shows all the three-volume novels listed in the ATCL bibliography that I have (so far) been able to identify in HathiTrust. Each dot represents a single novel. The novels have been represented as bags of words, generated from HathiTrust’s extracted features dataset, and then clustered using k-means clustering. I wondered if this sort of unsupervised clustering could identify genres within the dataset. While the three-volume format imposed certain kinds of uniformity across novels (especially in terms of length), a variety of genres thrived within this constraint. One critic, for instance, describes three central strands in “Victorian Popular Fiction”: “In minor fiction the major interests lie in the sensational novel, the romance or domestic love story, and the adventure tale, either historical or geographically exotic” (Terry 12). Would a clustering algorithm locate those (or other) trends?
After trying a few k values (and using the somewhat dubious “elbow
method” to find a number for k, I settled on five
clusters. (I’m continuing to explore ways to cluster this data, but this
post is about something odd I noticed along the way.) And it is the
result of that clustering that is visualized above. Each point
represents a novel; its location on the x-axis places it within one of
five clusters; its vertical position shows its year of publication (the
points are “jittered” and slightly transparent to aid viewing). To me,
such a visualization is a useful way of getting an overview of this
data; it shows not just how many novels were identified in each cluster,
but offers some sense of trends over time.
Perhaps you can detect some trends. The number of novels published per year increases across the dataset, so the increased number of points towards the top makes sense. Clusters 0 and 1 seem to increase, cluster 2 may decrease and cluster 3 seems mostly consistent. Maybe. But surely what jumps out is cluster 4. What’s going on with cluster 4?
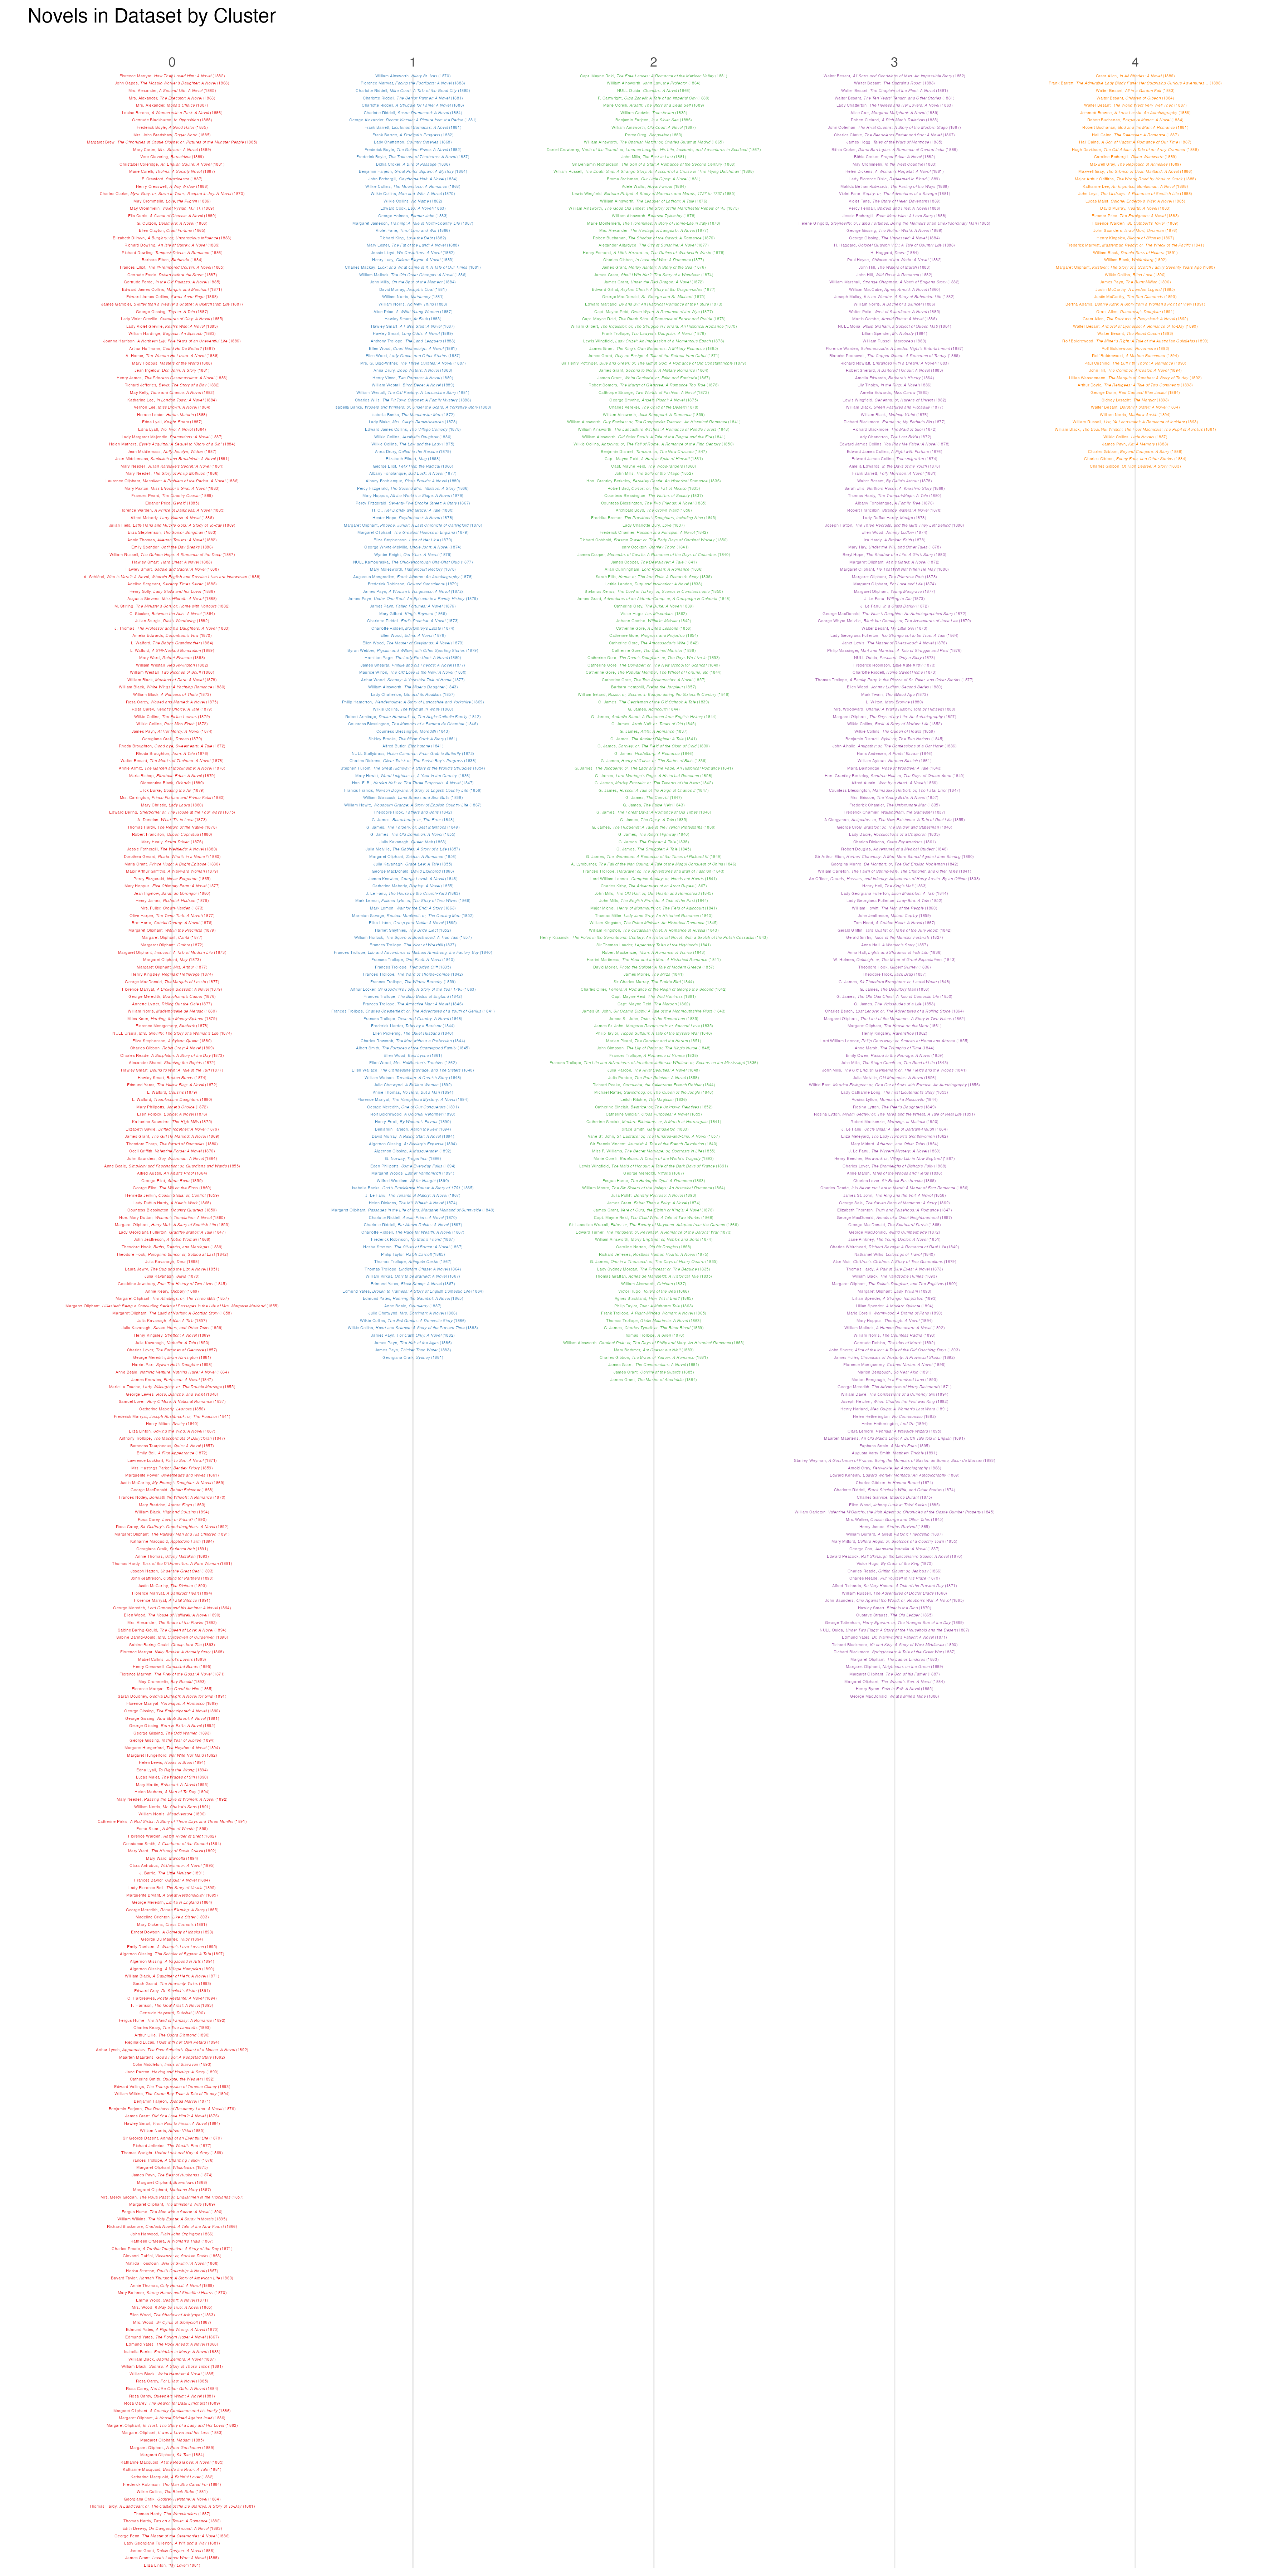
We have no insight yet into what similarities (what sets of word frequencies) are producing these clusters. Looking only at this visualization it is impossible to know if these clusters are meaningful at all. We could look over the titles of the novels in each cluster to see if the clusters make sense—but while interesting to look at (WARNING: large filesize—a 3 meg image), the titles alone are hard to parse.I will note that works by a single author do seem to collect within a cluster, which is promising I think.
To investigate further, I used tf-idf to identify the
terms most distinctive to each cluster. (I added all the novels from
each cluster together, in effect comparing five long novels to one
another). Here are the top-scoring (per tf-idf scores, as
implemented by scikit-learn
terms for cluster 4:
4: ['country', 'boy', 'understand', 'certain', 'really', 'master', 'ye', 'fellow', 'open', 'lay', 'dark', 'death', 'women', 'large', 'case', 'passed', 'tlie', 'nature', 'doubt', 'ask', 'hard', 'family', 'doctor', 'black', 'replied', 'read', 'son', 'god', 'air', 'brother', 'sat', 'wish', 'second', 'child', 'talk', 'water', 'suppose', 'called', 'help', 'brought', 'till', 'strange', 'present', 'dead', 'friends', 'captain', 'having', 've', 'hear', 'leave', 'began', 'rev', 'true', 'gave', 'story', 'mean', '7s', 'taken', 'believe', 'sea', 'cried', 'edited', 'set', 'matter', 'speak', 'hope', 'white', 'history', 'ready', 'word', 'gone', 'soon', 'light', 'end', 'does', 'sure', 'days', 'book', 'kind', 'boards', 'money', 'best', 'english', 'morning', 'london', 'looking', 'john', '3s', 'stood', 'want', 'answered', 'seen', 'small', 'wife', 'words', 'turned', 'friend', 'works', 'lord', 'far', 'years', 'round', 'door', 'hands', 'felt', '6s', 'right', 'voice', 'heard', 'got', 'home', 'course', 'work', 'told', 'better', 'took', 'thing', 'half', 'cr', 'saw', 'vols', 'yes', 'going', 'things', 'night', 'mother', 'll', 'asked', 'poor', 'moment', 'dear', 'left', 'girl', 'vol', 'mind', 'world', 'place', 'quite', 'heart', 'knew', 'head', 'oh', 'miss', 'let', 'people', 'illustrations', 'room', 'woman', '2s', 'father', 'post', 'illustrated', 'sir', 'love', 'look', 'just', 'house', 'lady', 'tell', 'looked', 'edition', 'went', 'men', 'make', 'shall', 'hand', 'young', 'new', 'thought', 'away', 'extra', 'long', 'came', 'great', 'eyes', 'face', 'day', 'mrs', 'way', 'say', 'think', 'come', 'life', 'old', 'good', 'svo', 'know', 'time', 'cloth', 'crown', 'like', 'little', 'did', 'mr', '6d', '8vo', 'lrb', 'man', 'rrb', 'said']Such a list of terms invites critical fabulation: perhaps this
cluster of novels, appearing largely after 1880, is from novels about
country boys who come to
really understand certain elements of
nature, such as
dark death; and perhaps these novels
became especially compelling starting in the wake of the passage of the
Reform Act of
1867 and the Education
Act of 1870, as a certain vision of rural working-class simplicity
was increasingly complicated, especially in the minds of the educated
middle class who formed a crucial part of the readership of three-volume
novels. Is that a compelling story? (I hope not.)
What jumped out to me in this list were tokens like 7s,
3s, 6s, half, cr,
vols, vol, illustrations,
2s, illustrated, 6d, and
8vo. Some (7s, 3s, 6s, 2s, 6d) are British, pre-decimalization prices.
Others (half, cr [short for crown],
vols, vol, illustrations, and
8vo) are terms for book format. And both prices and book
format terms are typical of book advertisement lists.
I am now pretty confident that initial hunch was right: cluster 4 was created by changes in advertising practice. The remainder of this post is about how I convinced myself that this hunch was true.
A Laborious Exercise in Hunch-Proving
I first searched through the texts to find pages where those terms for money and format were most common. These pages, indeed, were typically advertising, almost always at the end of volumes. From this process of manual inspection, I identified 200 pages of advertising in the dataset; I also collected 200 pages from novels in the dataset that I assumed were not advertising (by randomly selecting pages from the middle 75% of volumes). These 400 pages offered a dataset from which I trained a logistic regression classifier to distinguish advertising from non-advertising pages. Holding out a quarter of pages as a test set, the classifier reported 100% accuracy on the held-out test data.
I then used that classifier on every page in the dataset (of three-volume novels listed in ATCL and identified in HathiTrust), identifying about 6,100 pages of advertising in the entire dataset. With this data I was able to begin to investigate the presence of advertising across my sample of three-volume novels.
An important first summary is offered by this graph:
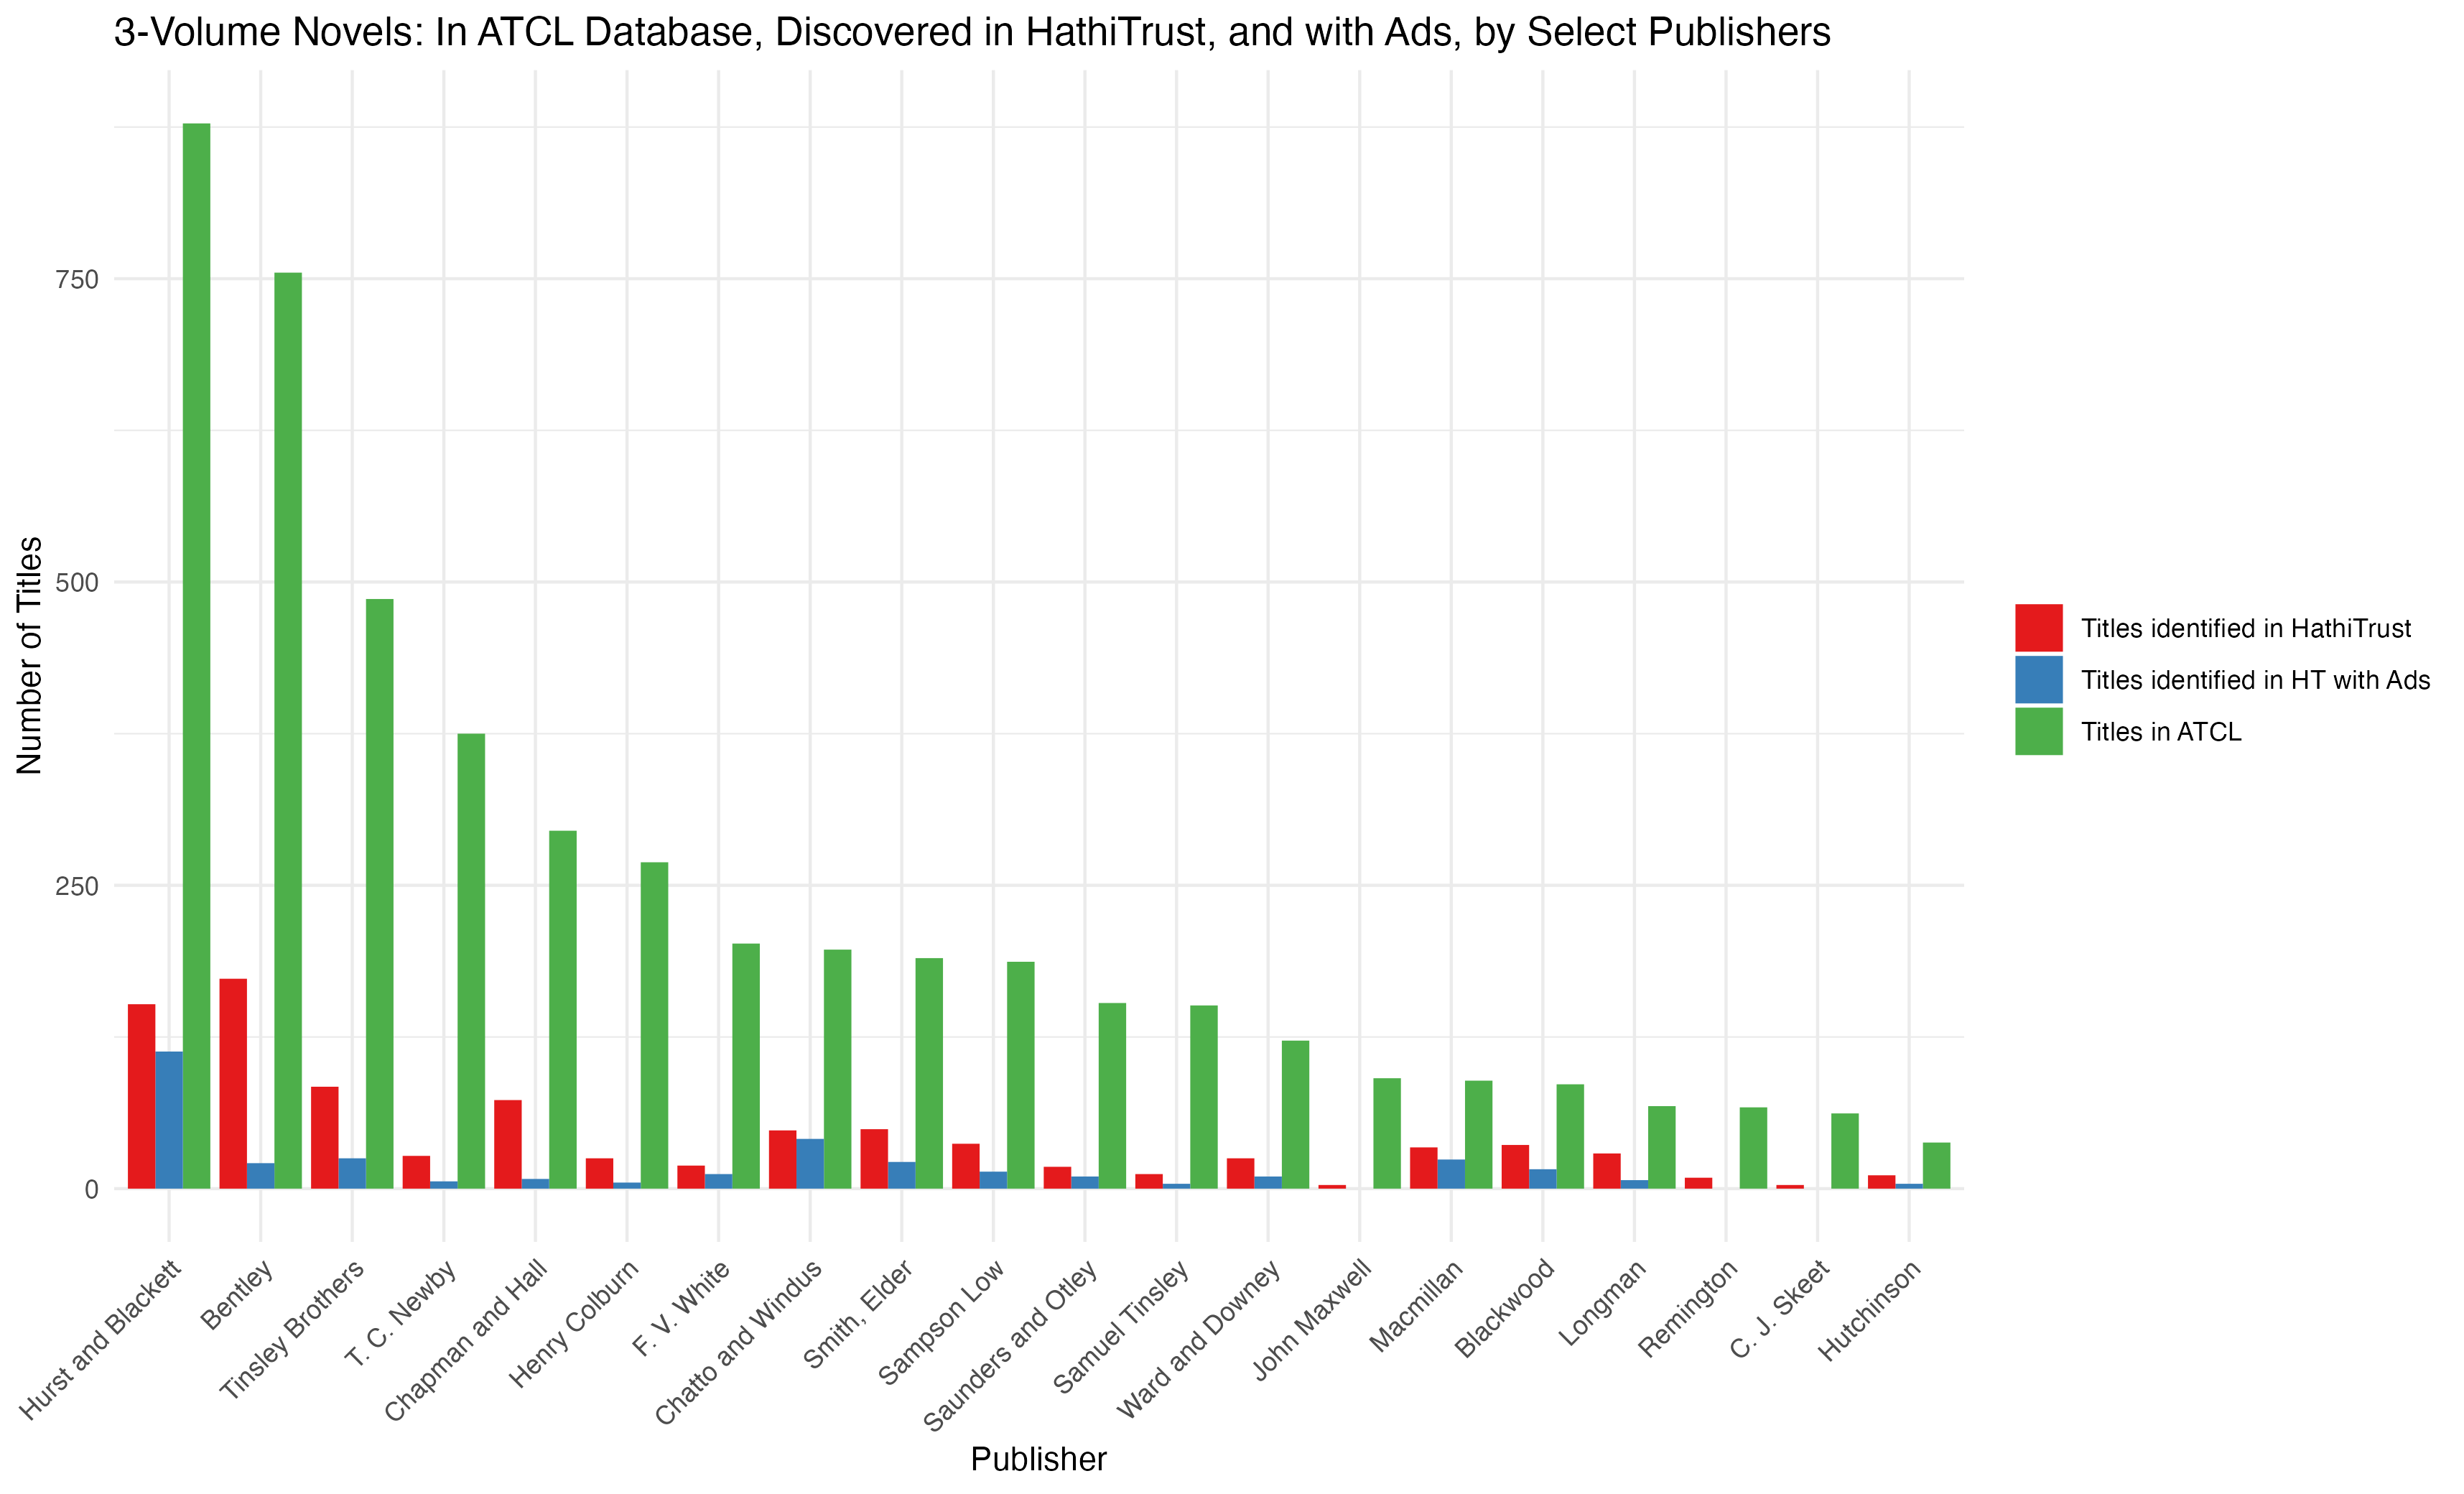
First: this graph reminds me that I am looking at a subset of a much larger bibliography. The ATCL bibliography (when I last downloaded it; it is continuously updated and I’m due for a re-up) listed 22,000 titles. Of those about 5,000 are three-volume novels. And within those 5,000 three-volume novels in ATCL I have identified about 1,000 in HathiTrust—or nearly 20%. But that 20% is not consistent across publishers.
| Publisher | Titles in ATCL | Titles identified in HathiTrust | Percentage Identified |
|---|---|---|---|
| Hurst and Blackett | 878 | 152 | 17.3 |
| Bentley | 755 | 173 | 22.9 |
| Tinsley Brothers | 486 | 84 | 17.3 |
| T. C. Newby | 375 | 27 | 7.2 |
| Chapman and Hall | 295 | 73 | 24.7 |
| Henry Colburn | 269 | 25 | 9.3 |
| F. V. White | 202 | 19 | 9.4 |
| Chatto and Windus | 197 | 48 | 24.4 |
| Smith, Elder | 190 | 49 | 25.8 |
| Sampson Low | 187 | 37 | 19.8 |
| Saunders and Otley | 153 | 18 | 11.8 |
| Samuel Tinsley | 151 | 12 | 7.9 |
| Ward and Downey | 122 | 25 | 20.5 |
| John Maxwell | 91 | 3 | 3.3 |
| Macmillan | 89 | 34 | 38.2 |
| Blackwood | 86 | 36 | 41.9 |
| Longman | 68 | 29 | 42.6 |
| Remington | 67 | 9 | 13.4 |
| C. J. Skeet | 62 | 3 | 4.8 |
| Hutchinson | 38 | 11 | 28.9 |
For some reason, for instance, I’ve only identified 3 of the 91 titles published by John Maxwell. This may be a failure in how I’m finding novels. It may be attributable to the HathiTrust dataset itself. The ATCL bibliography is focused on British publishing Indeed, the three-volume novel is a British phenomenon; the artificial price-structure that enabled it did not operate in the U.S. or continental Europe. but HathiTrust’s collection is a culled from U.S. libraries; this may explain the gaps. I really don’t know and I don’t think any of this issues affect the particular mystery I’m trying to solve (the case of cluster 4), but it is worth remembering.
These provisos acknowledged, I think we can say that publishers varied widely in whether they included advertising. Hurst and Blackett, the biggest publisher in the dataset, included advertising in most of their titles; but many publishers included none at all.
Within my data, only three publishers included advertisements in more than half of their three-volume titles: Chatto and Windus, Hurst and Blackett, and Macmillan.
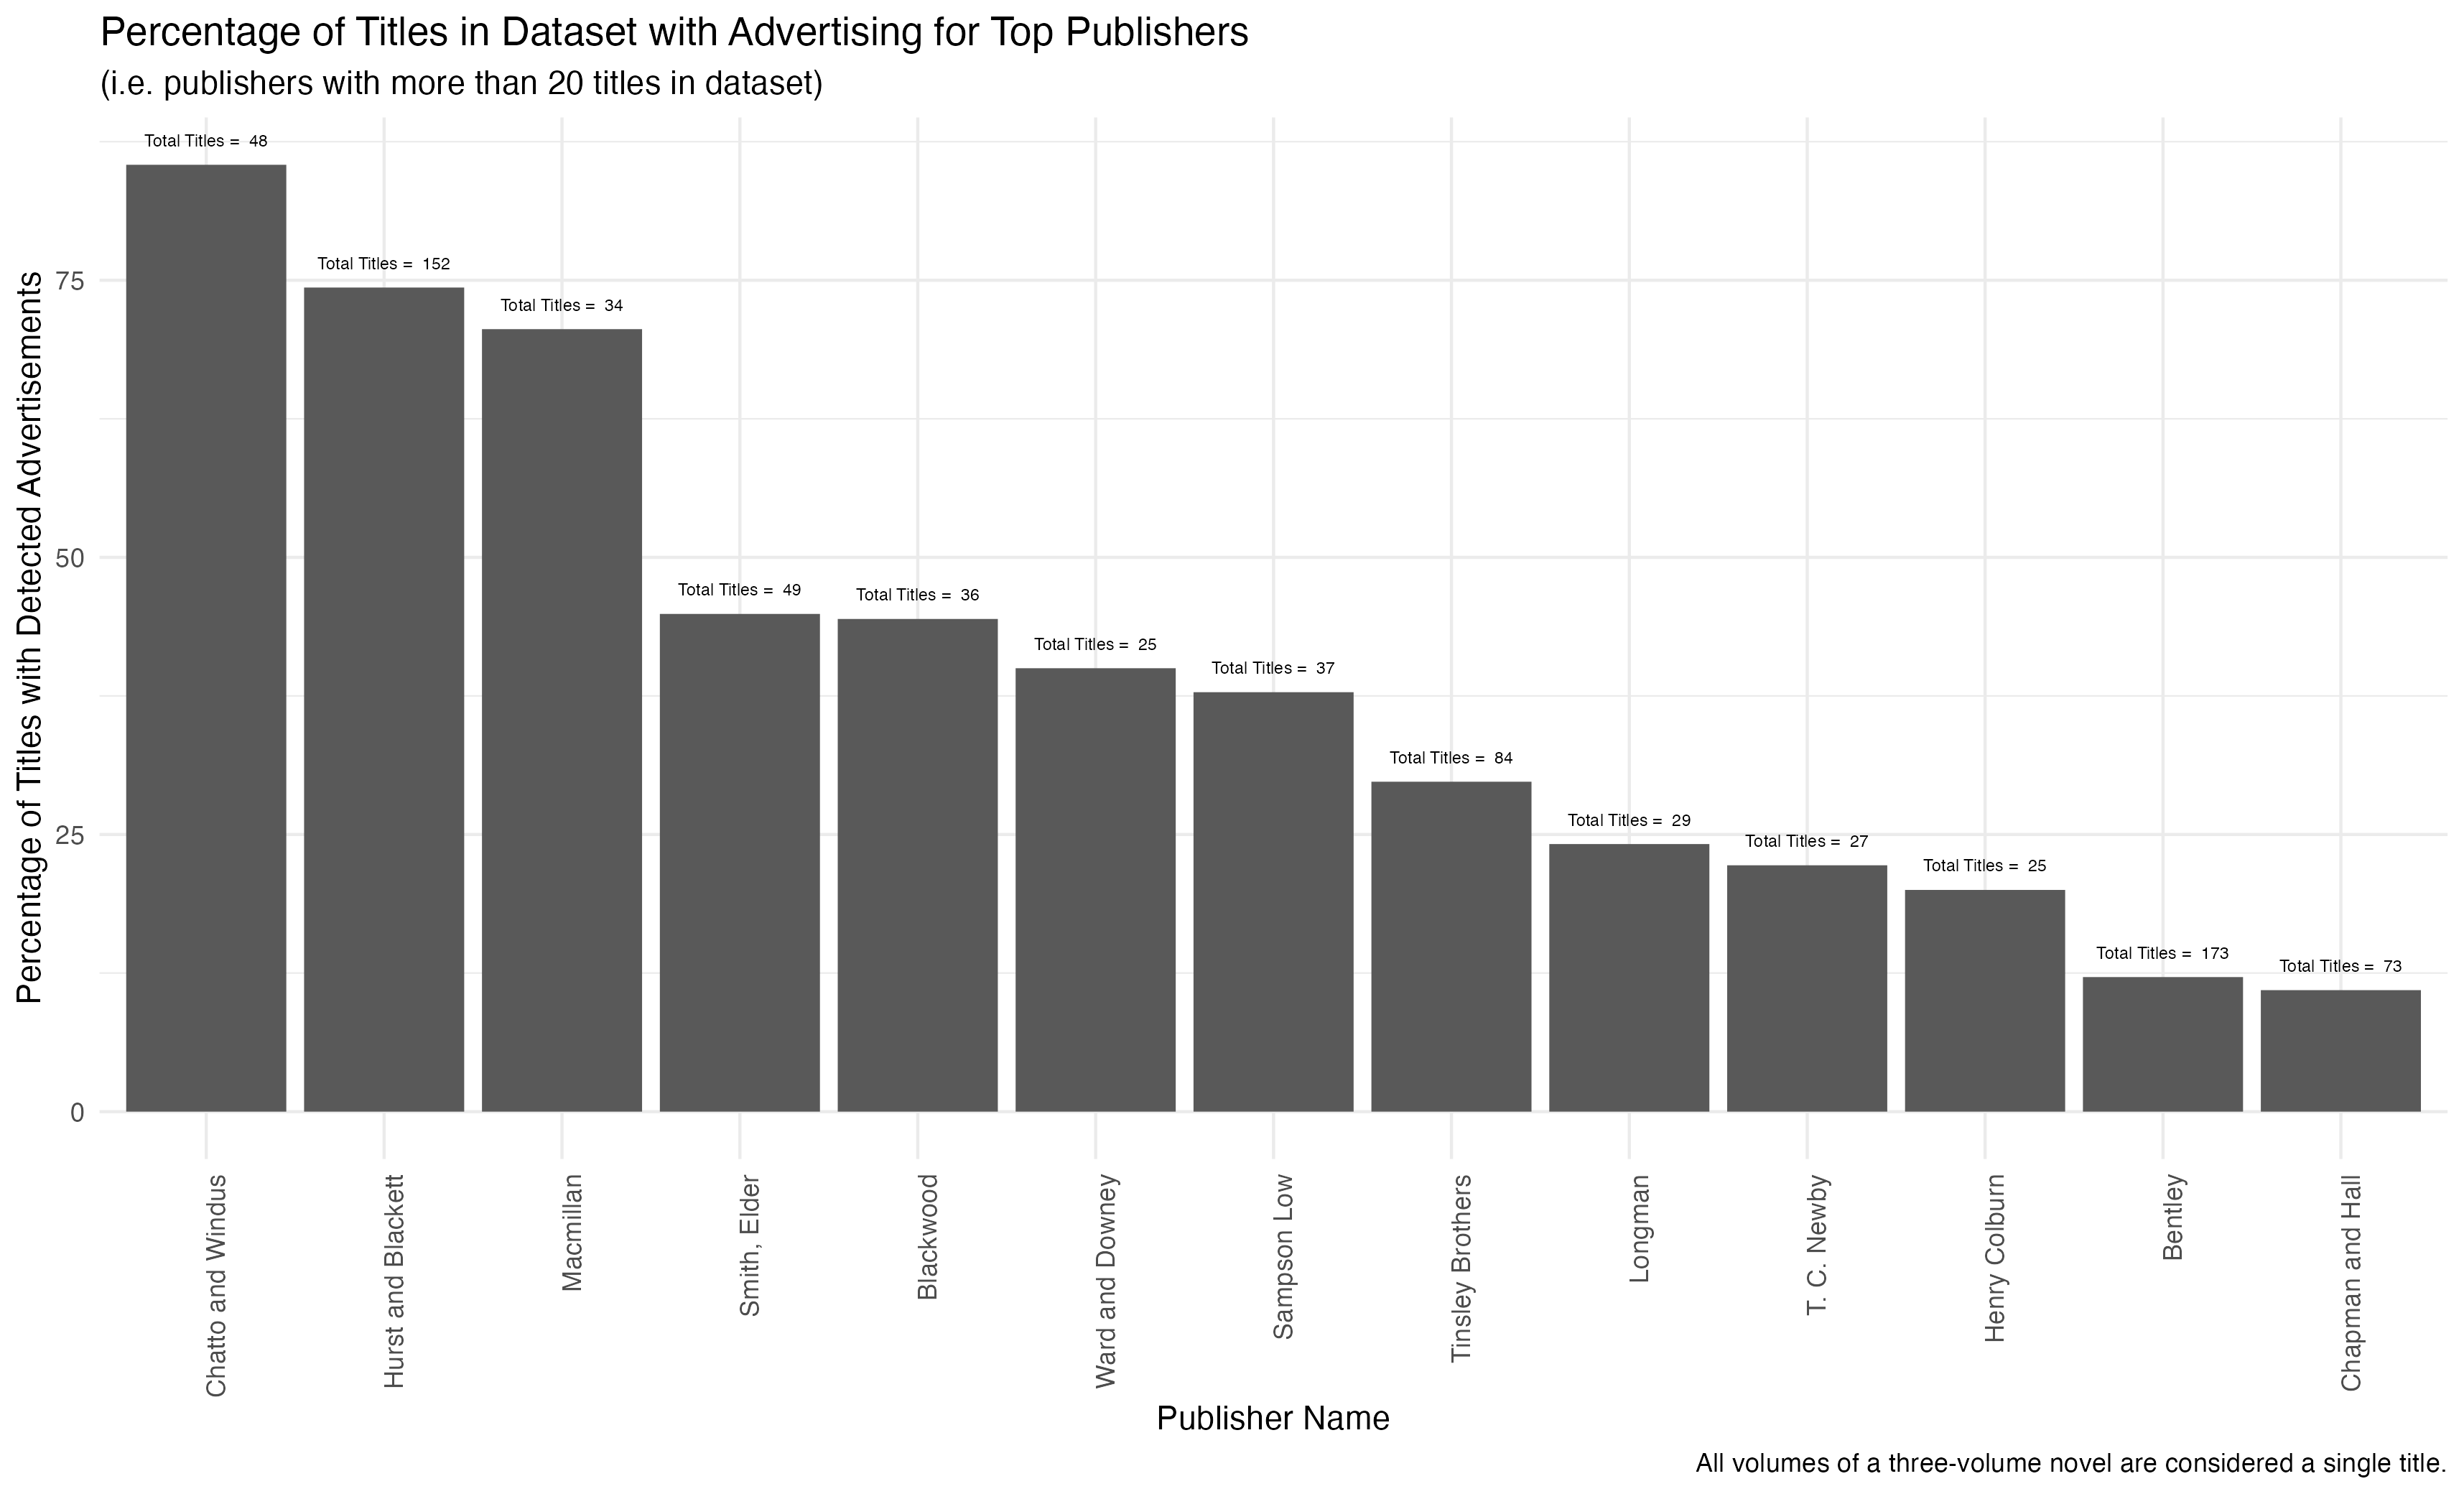
But this observation is further complicated by additional variables. First: publishers change their practices over time and so these percentages may be hiding trends within the output of any publisher. Second, as a measure of advertising the “percentage of titles with ads” conflates a single page of advertising with multiple pages. And, indeed, some titles have a single page of advertisements, while others may include many pages of advertisements. This latter point includes a further complication: regardless of the number of pages, a publisher may adjust the size of the typeface to fit more text on a single page. In short, “percentage of titles with advertisements” obscures two variables: time and amount of advertising (where advertising is probably measured in words of advertisement).
Let’s first look at select advertisers to investigate trends in advertisement (here measured in pages):
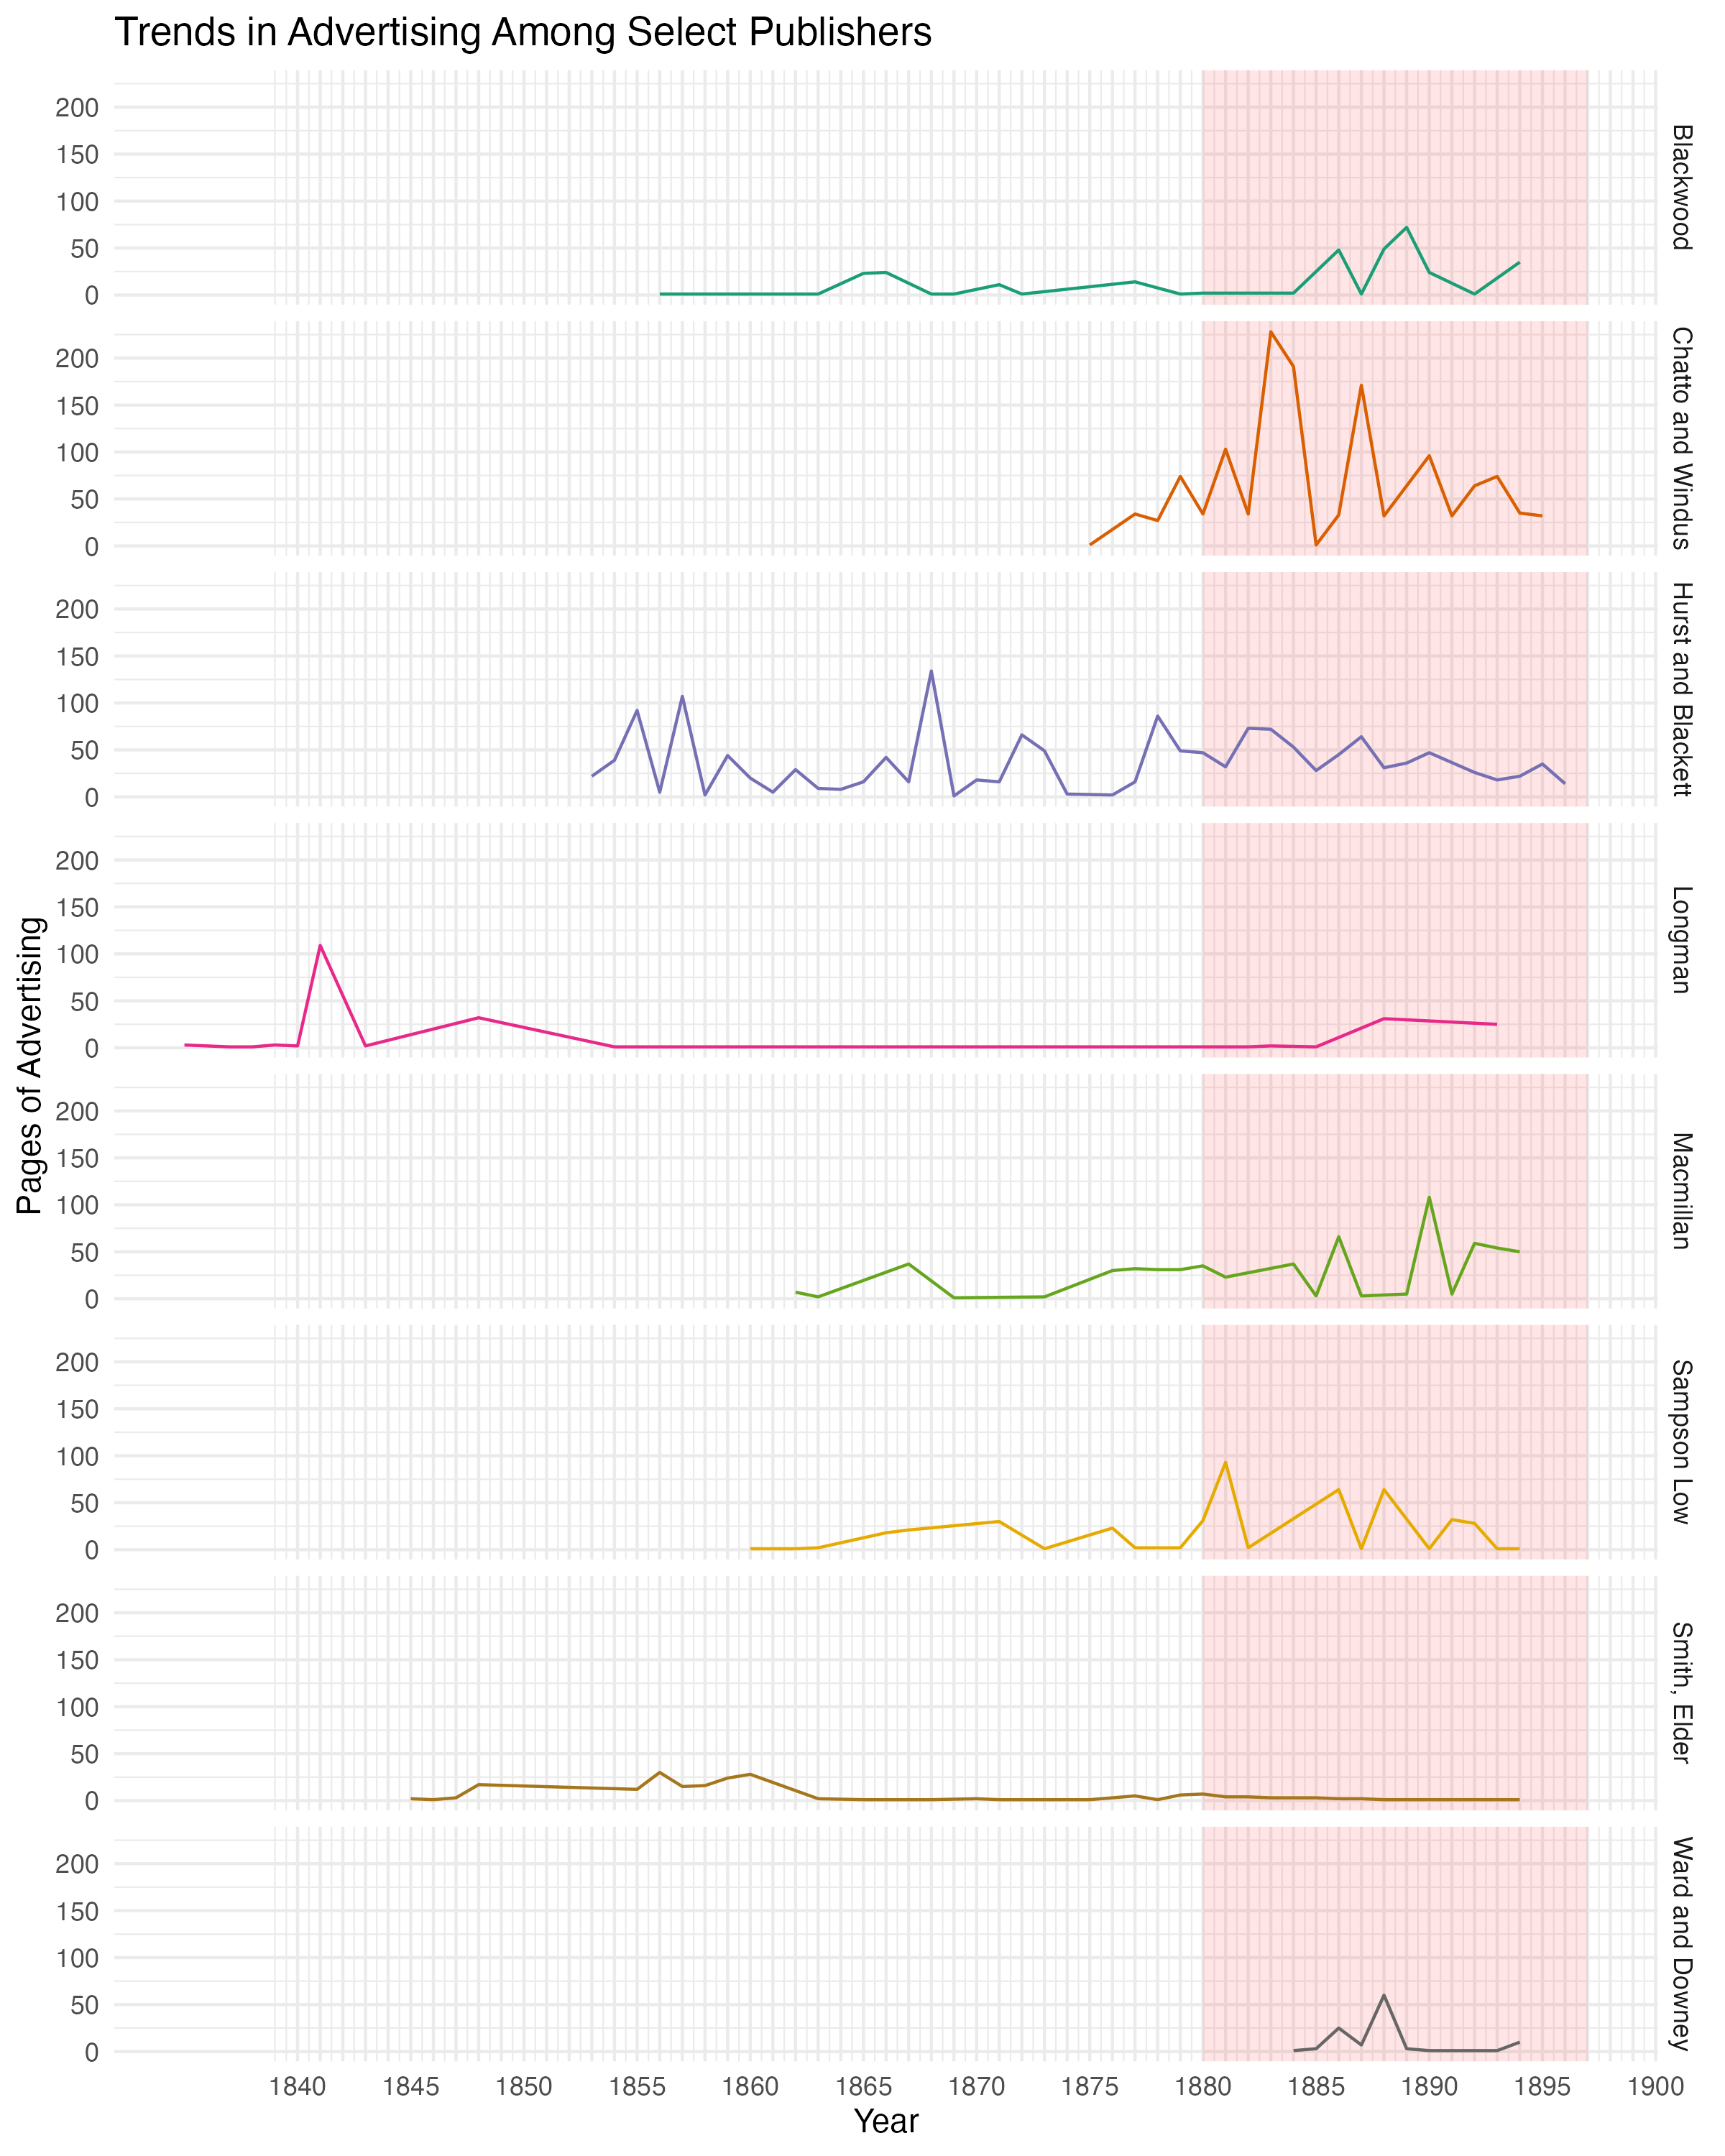
The red shaded area represents the the years when cluster 4 emerges (1880–1897). While these trends are a bit jagged (there’s no smoothing here), it seems clear that in the period of interest Chatto and Windus emerges as the main contributor of advertising to this dataset.
We can also look at how many words of advertising per page were detected. I’ve added smoothing lines to make the trends clearer: while Hurst and Blackett had on average more words per page of advertising than other publishers, they had fewer words per page of advertising than either Macmillan or Chatto and Windus, publishers who increased their total pages of advertising in the period when cluster 4 emerges.
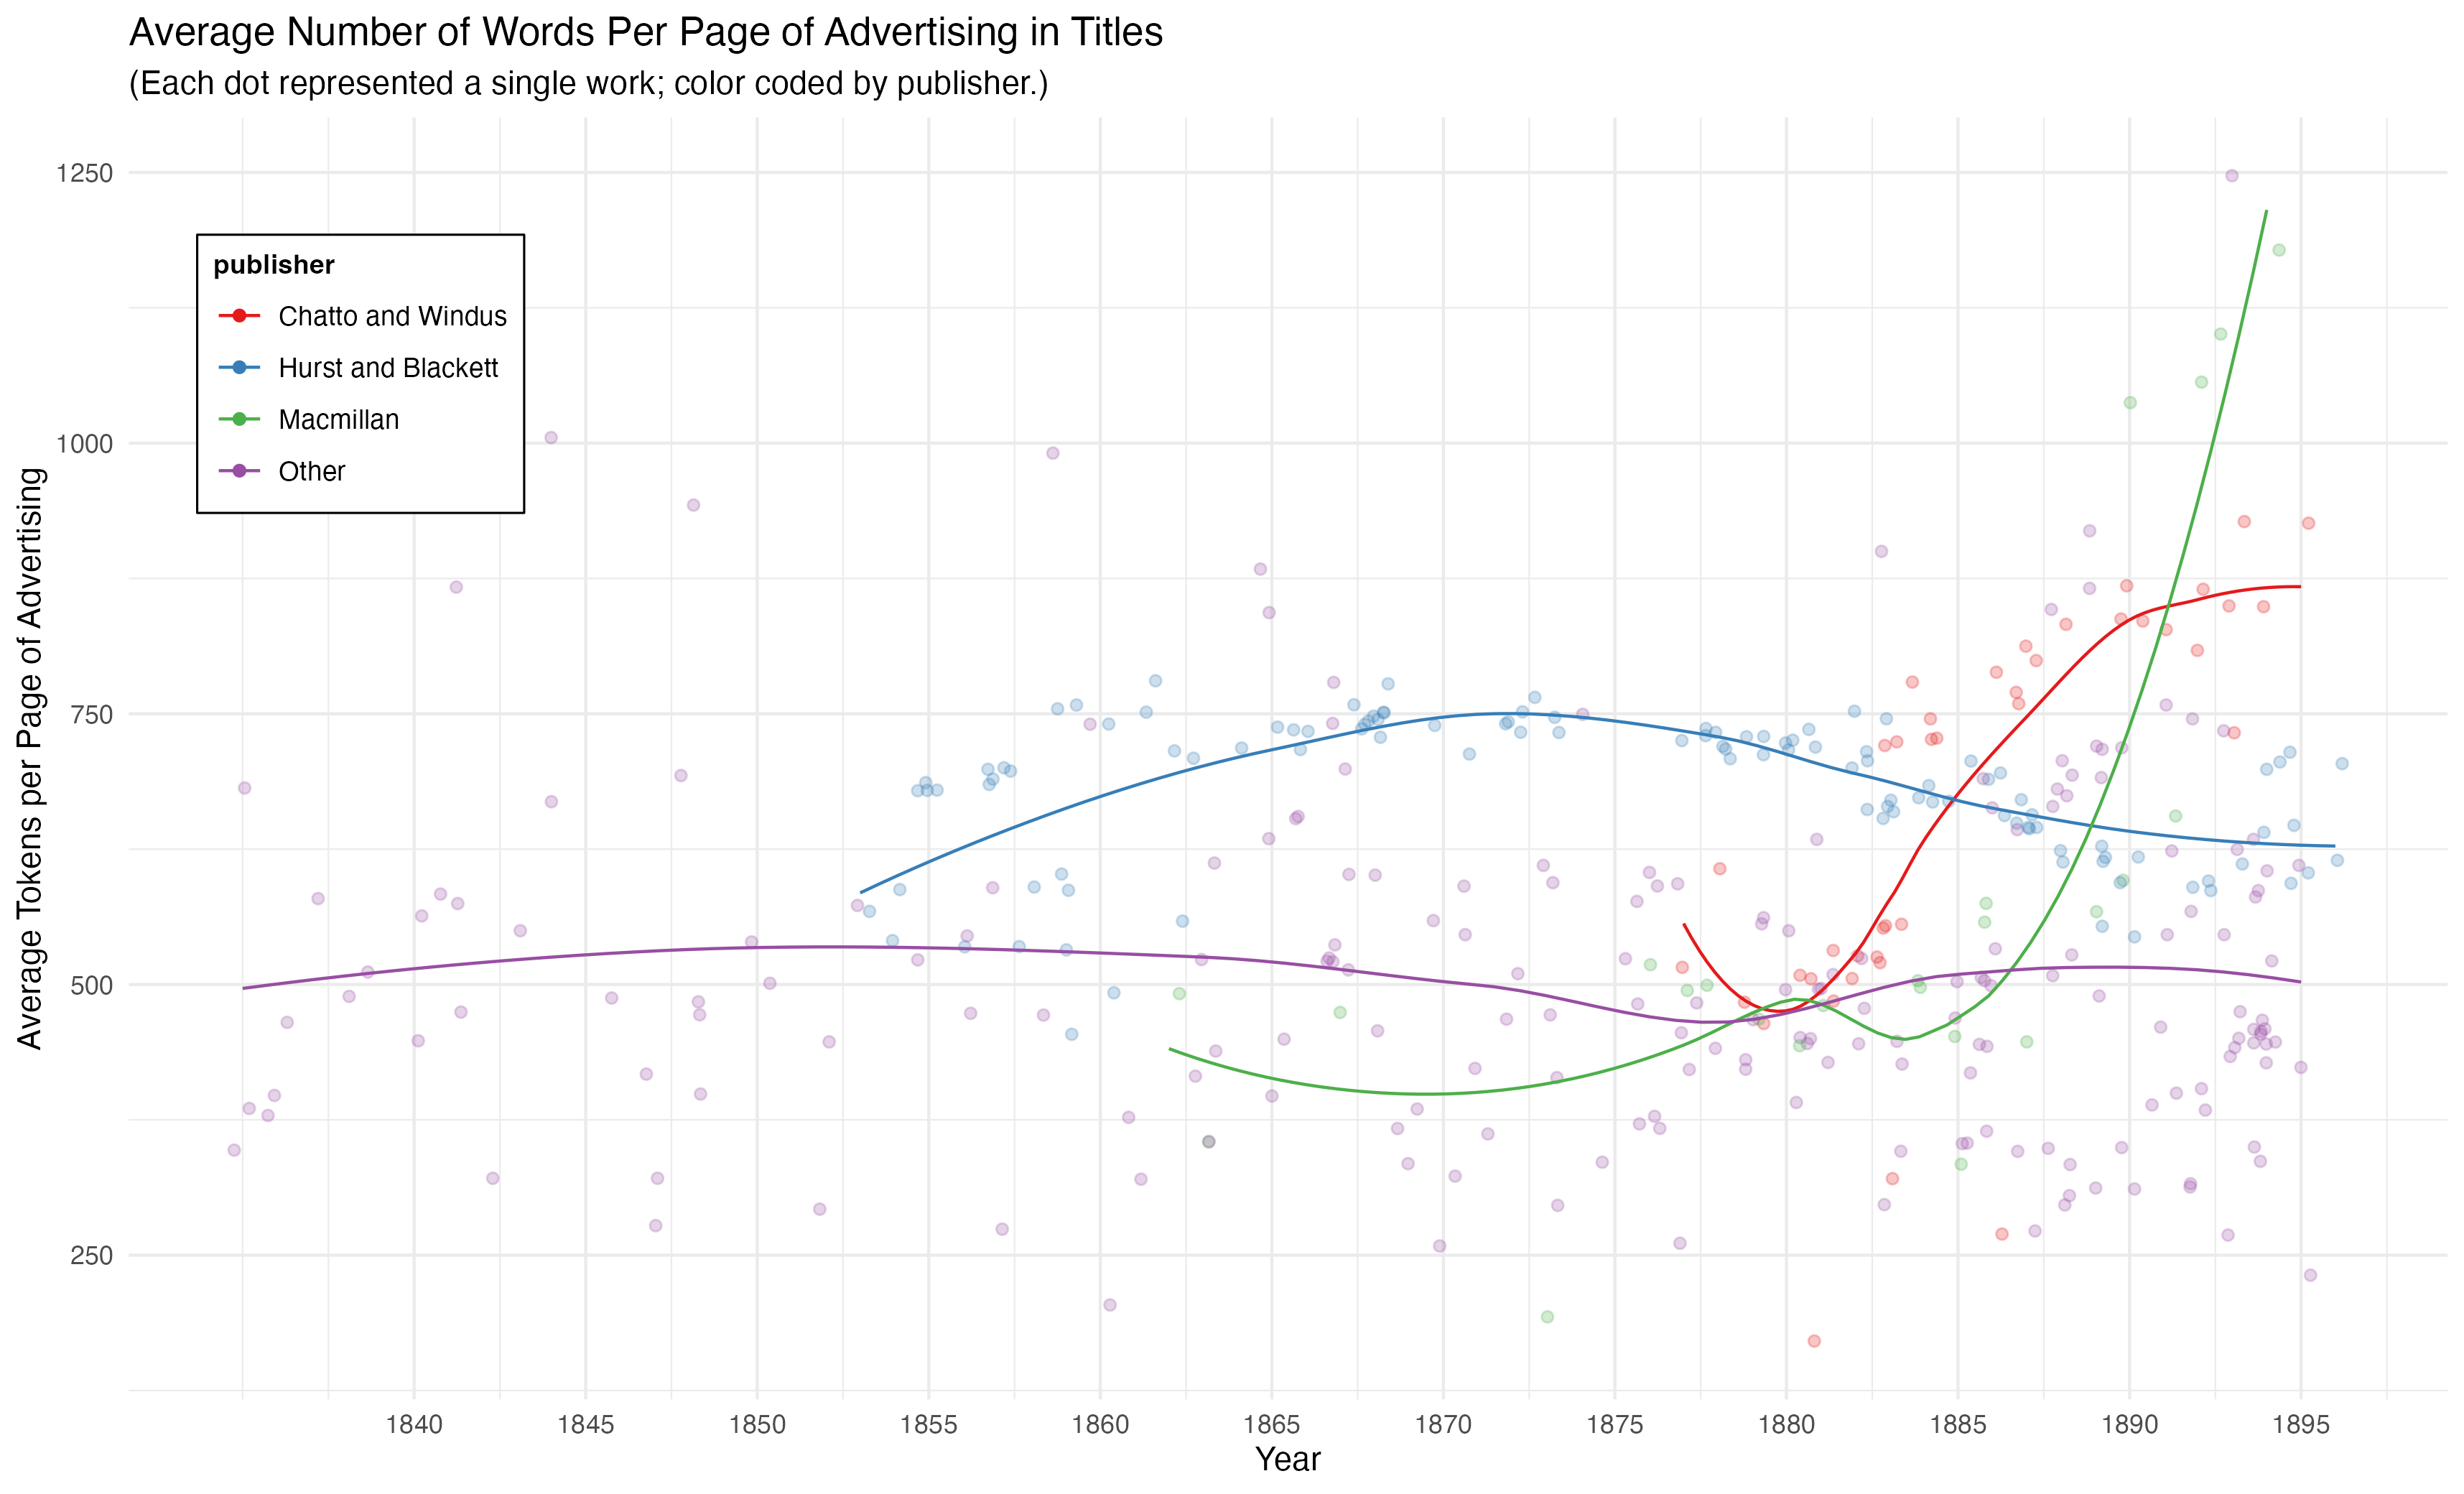
It is true that “advertising increases” during the period when cluster 4 emerges. This is true both in terms of an increase in the total number of pages of advertising over the period and in the amount of advertising per page. The increase in words per page is especially worth noting because once those words were added to the rest of the text, for purposes of clustering, they would have had an effect larger than even the number of pages would suggest.
Even as advertising is increasing across this period, this increase, however, is not uniform; it reflects particular publishers, especially Chatto and Windus.
So far we have a cluster that emerges in a period; a series of trends in advertising that increase in that period; and some words in the tf-idf scores that suggest a connection. But it was the following two visualizations that convinced me that cluster 4 was produced by these changes in advertising.
The first is a version of my original visualization, now color coded to contrast books published by Chatto and Windus with other publishers.
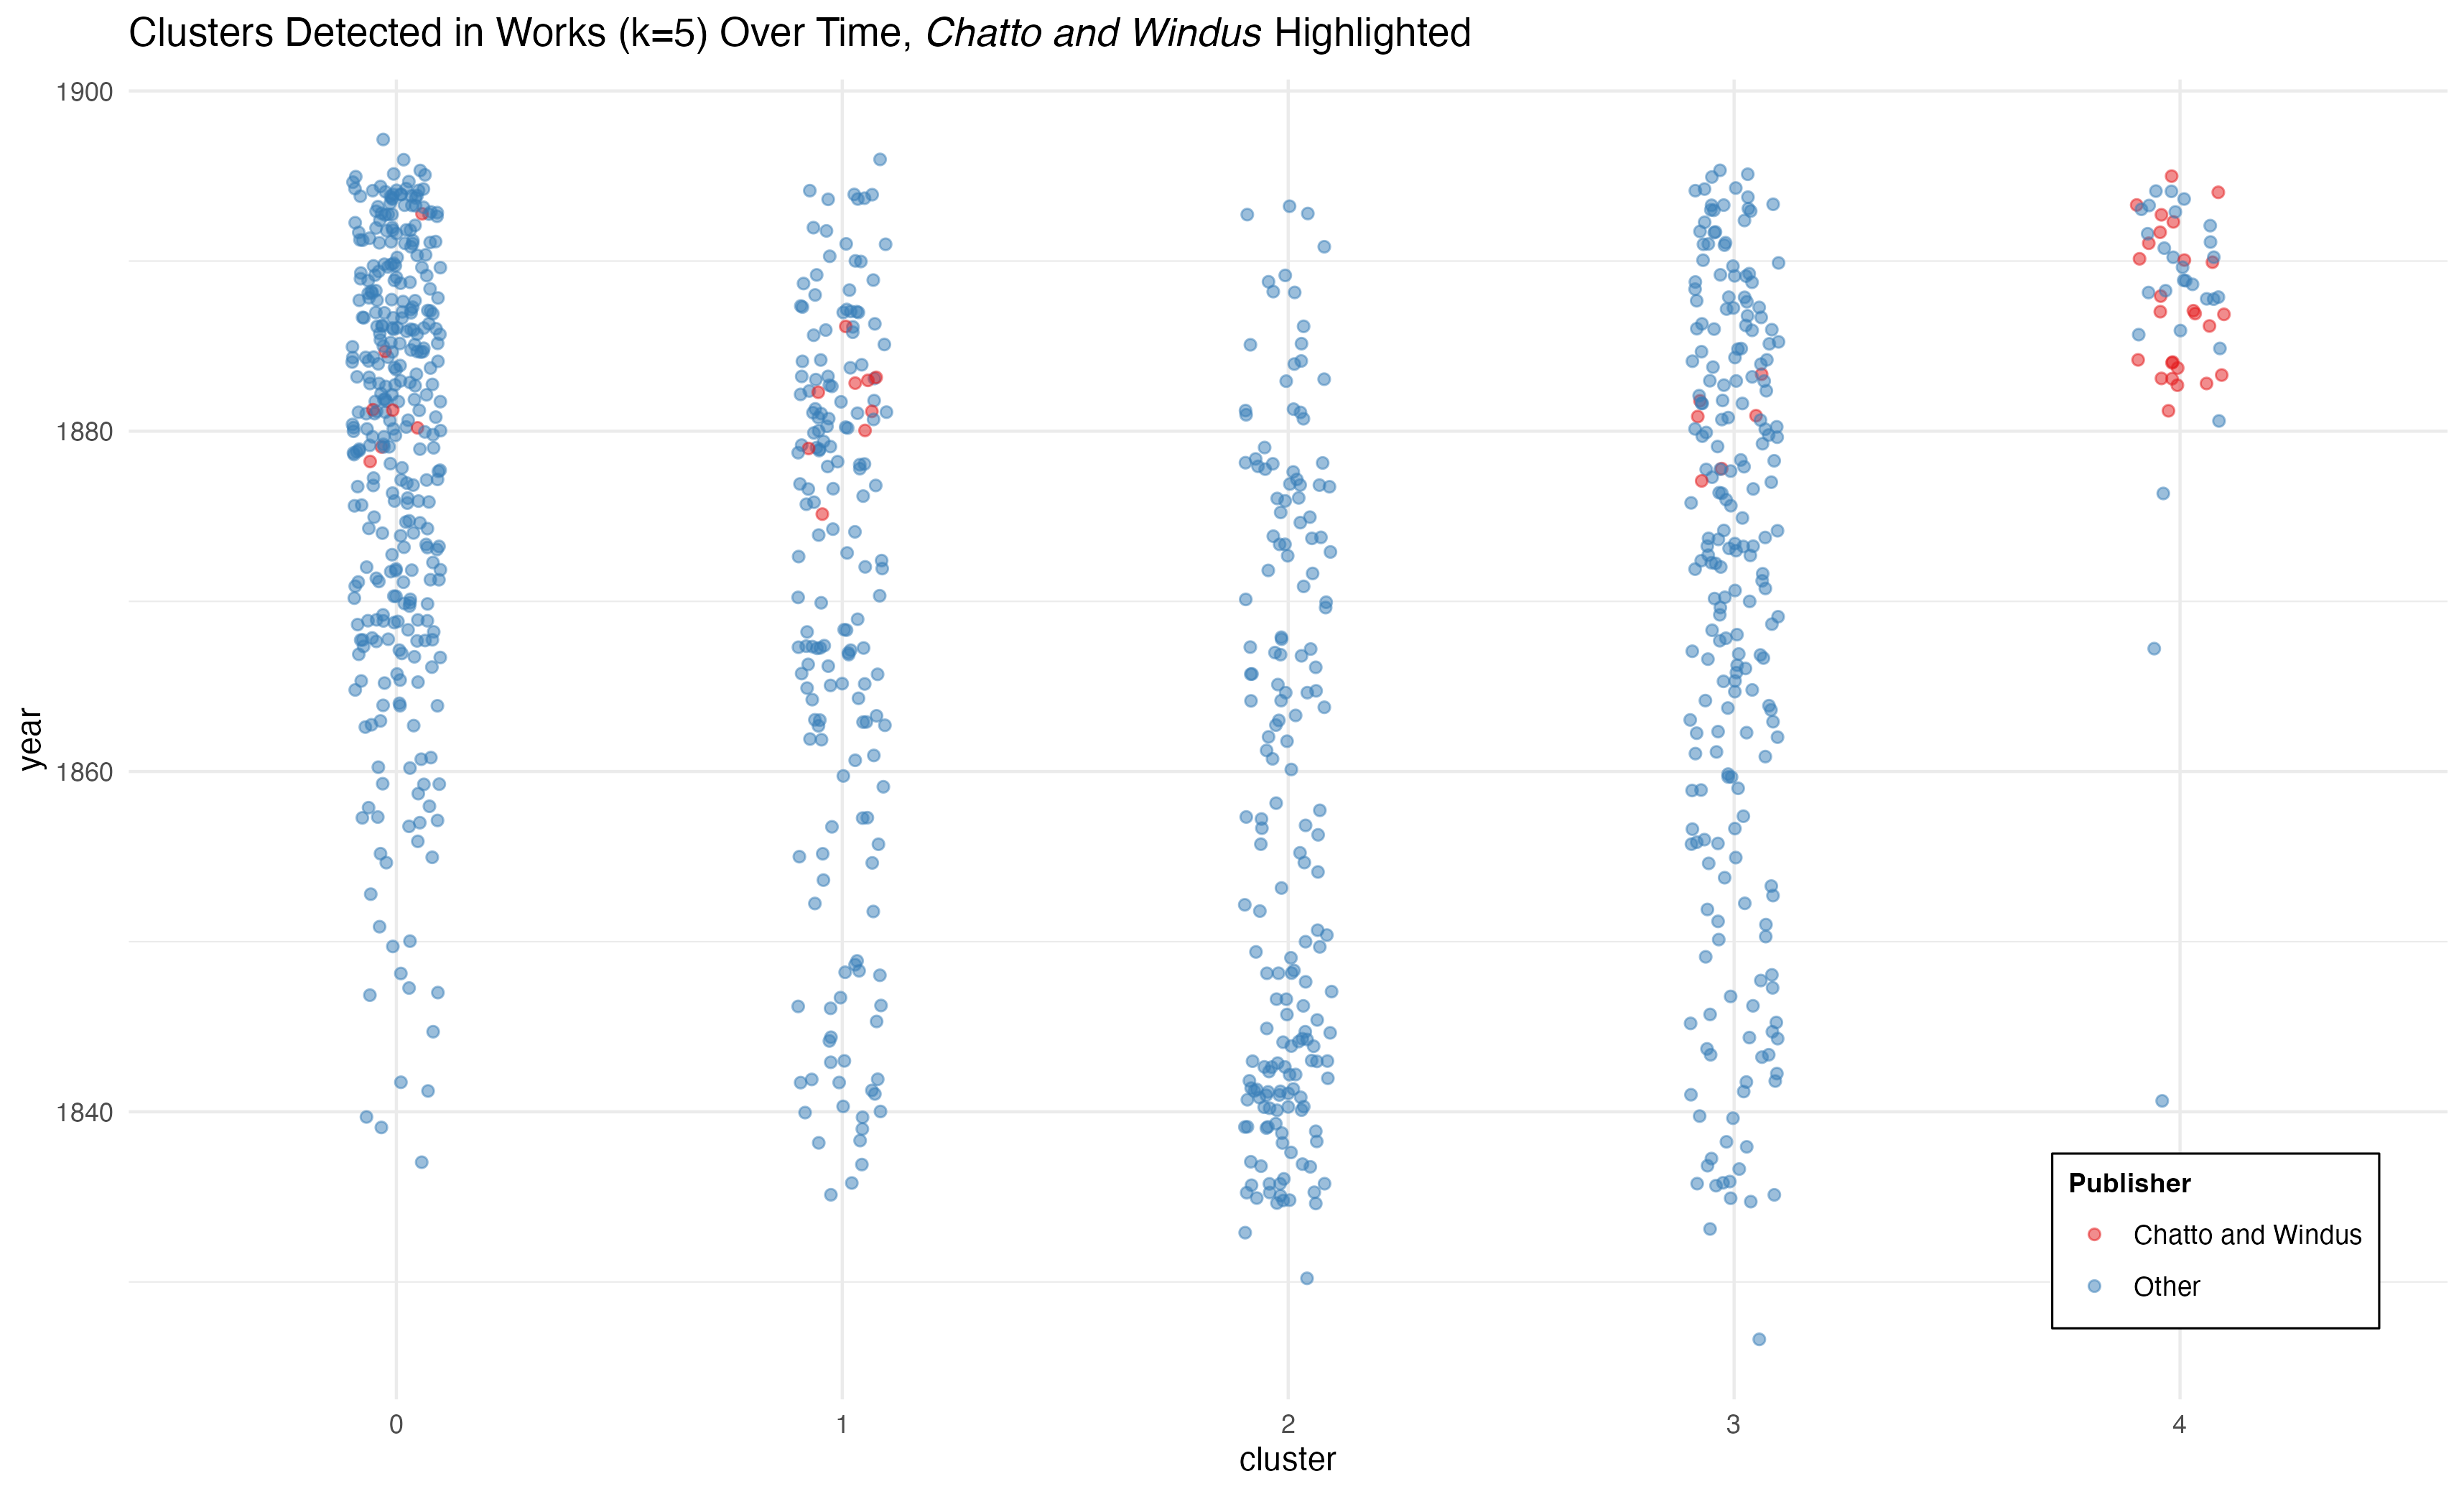
While Cluster 4 is not generated exclusively by Chatto and Windus, Chatto and Windus do dominate that cluster. 48% percent of the works in cluster 4 were published by Chatto and Windus (who was responsible for 10% of the books published in the period from 1880 to 1897); and 62% of the 42 works published by Chatto and Windus in the period were classified as cluster 4. So—there is strong correlation between cluster four and Chatto and Windus.
A second image color codes the points based on the number of pages of advertising detected in the title.
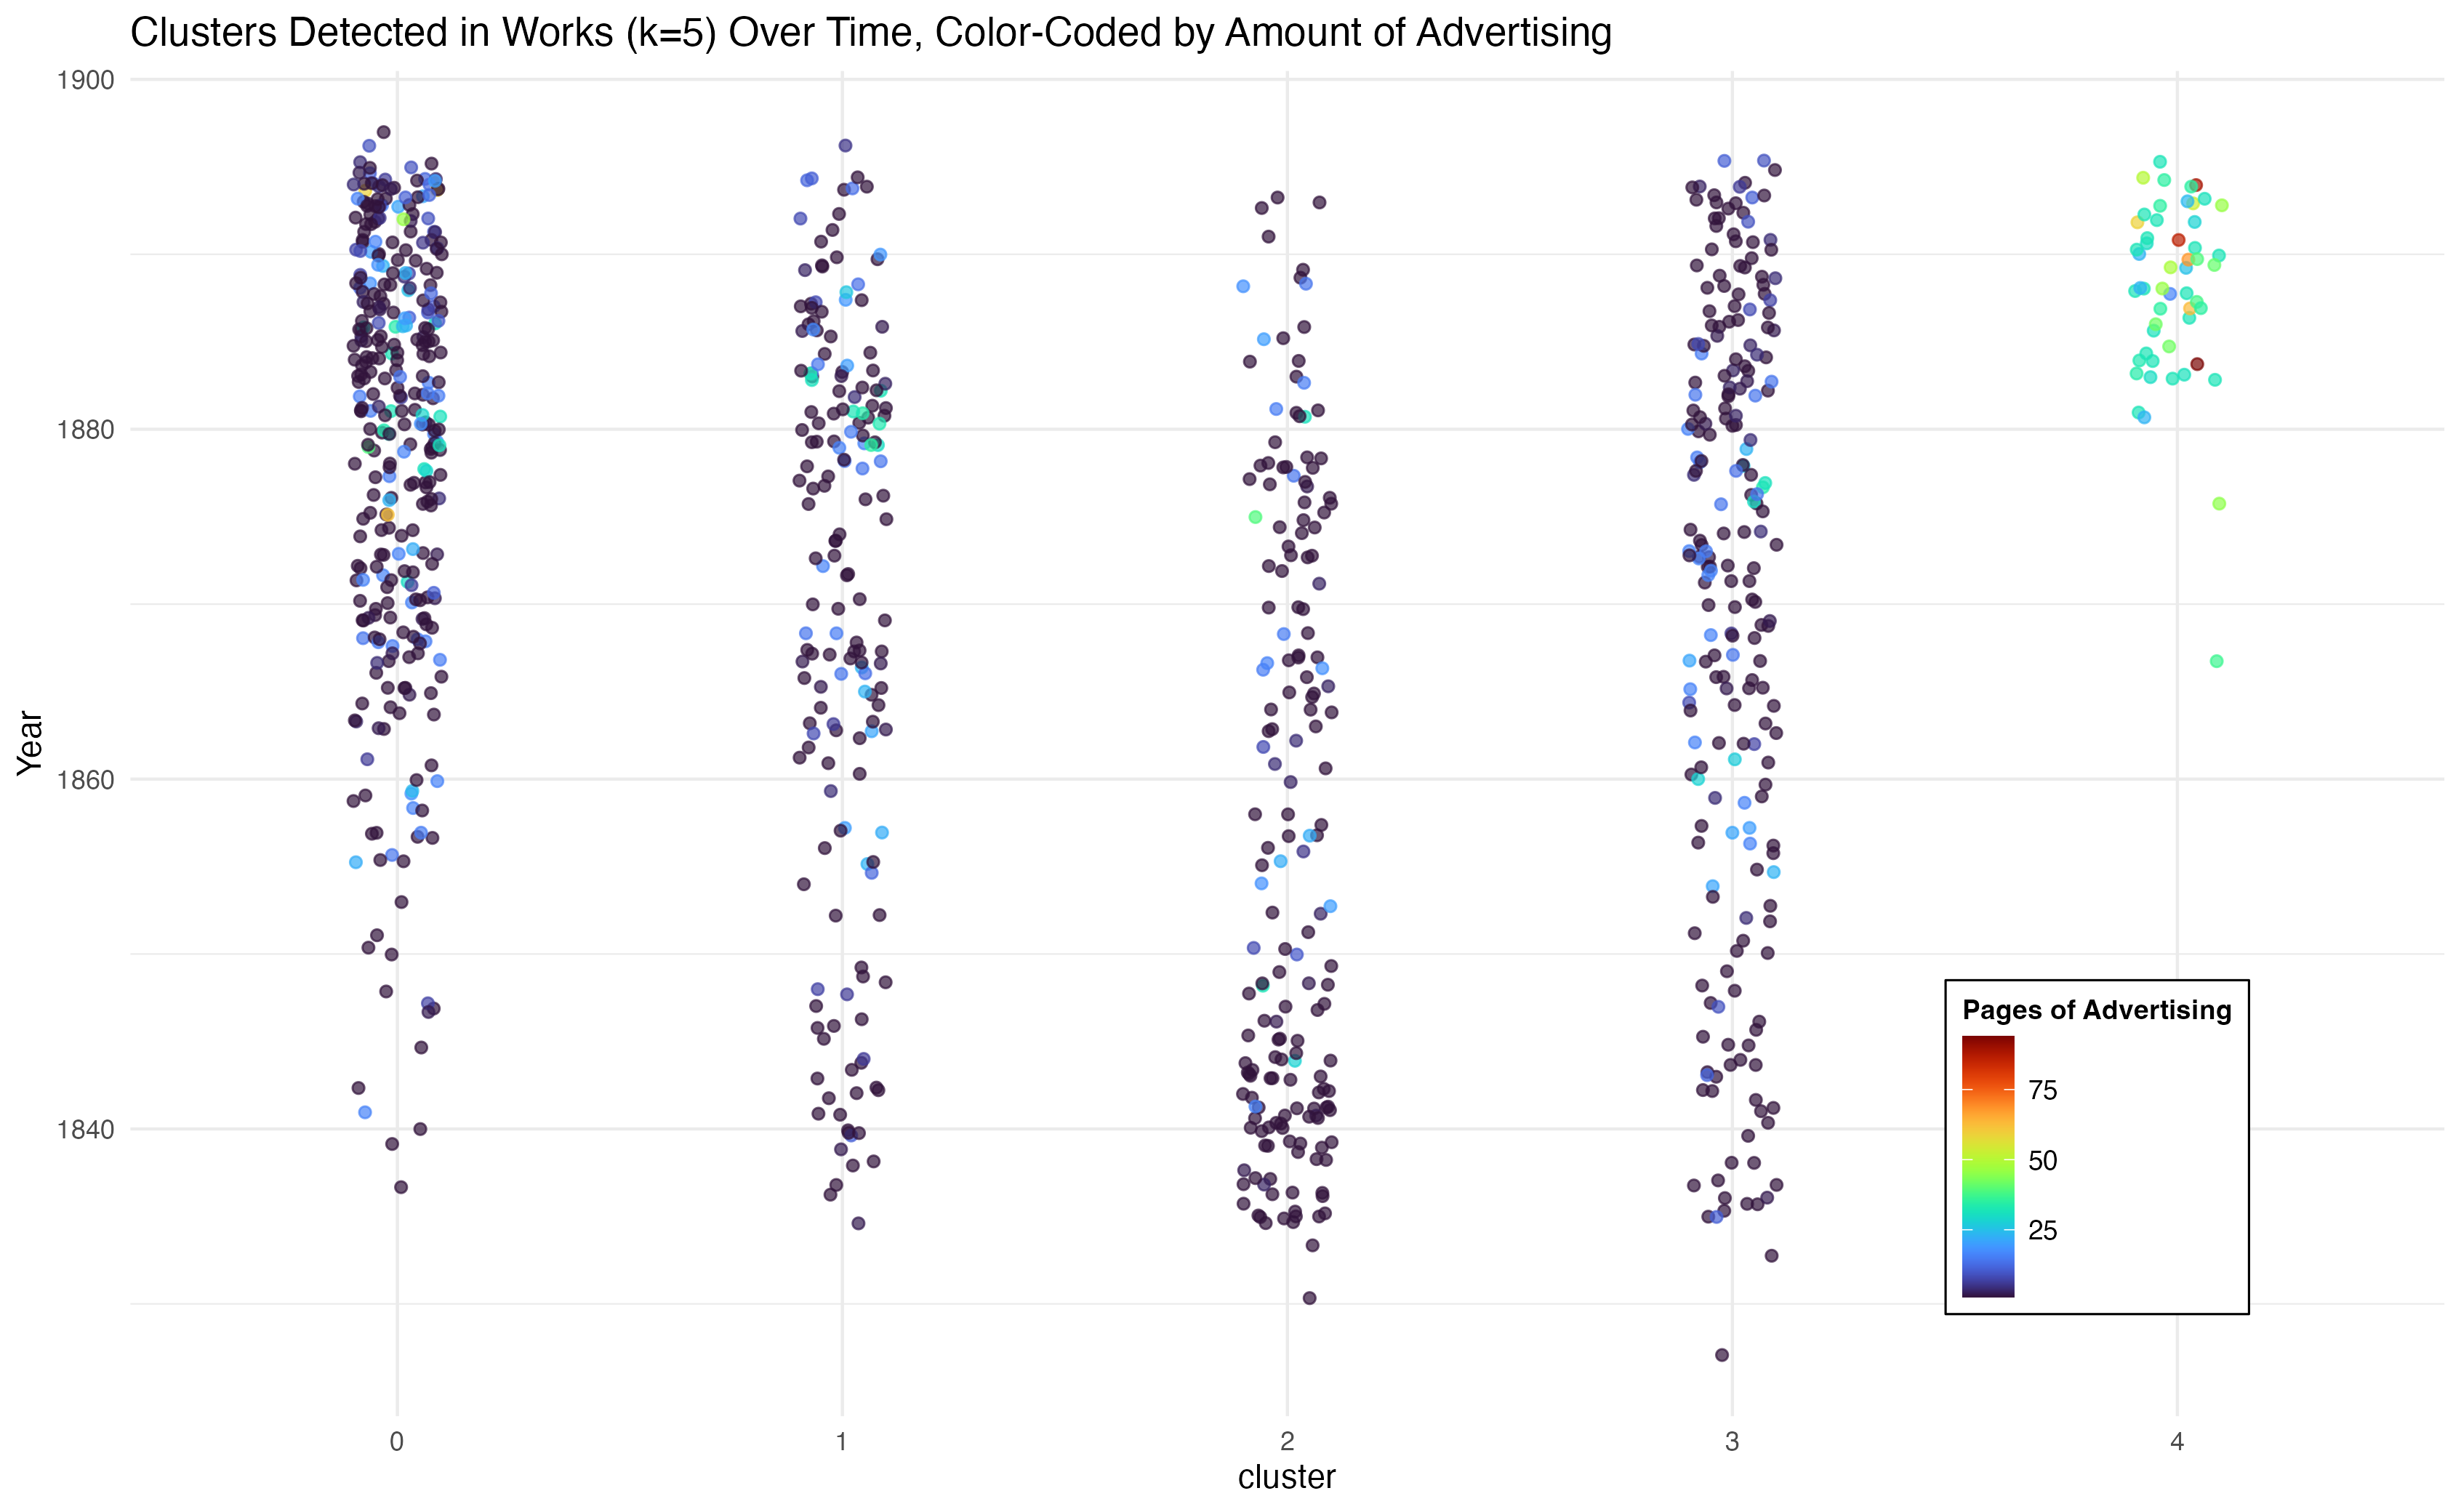
These visualizations convince me that cluster 4 is a product of a change in how much advertising was included in the three-volume novels in the dataset, with the bulk of the change produced by Chatto and Windus.
And, having thus laboriously concluded that advertising was contaminating the clustering, it is a relatively simple matter to remove the advertising pages and cluster again. Doing so eliminates the anomalous cluster that emerges around 1880.
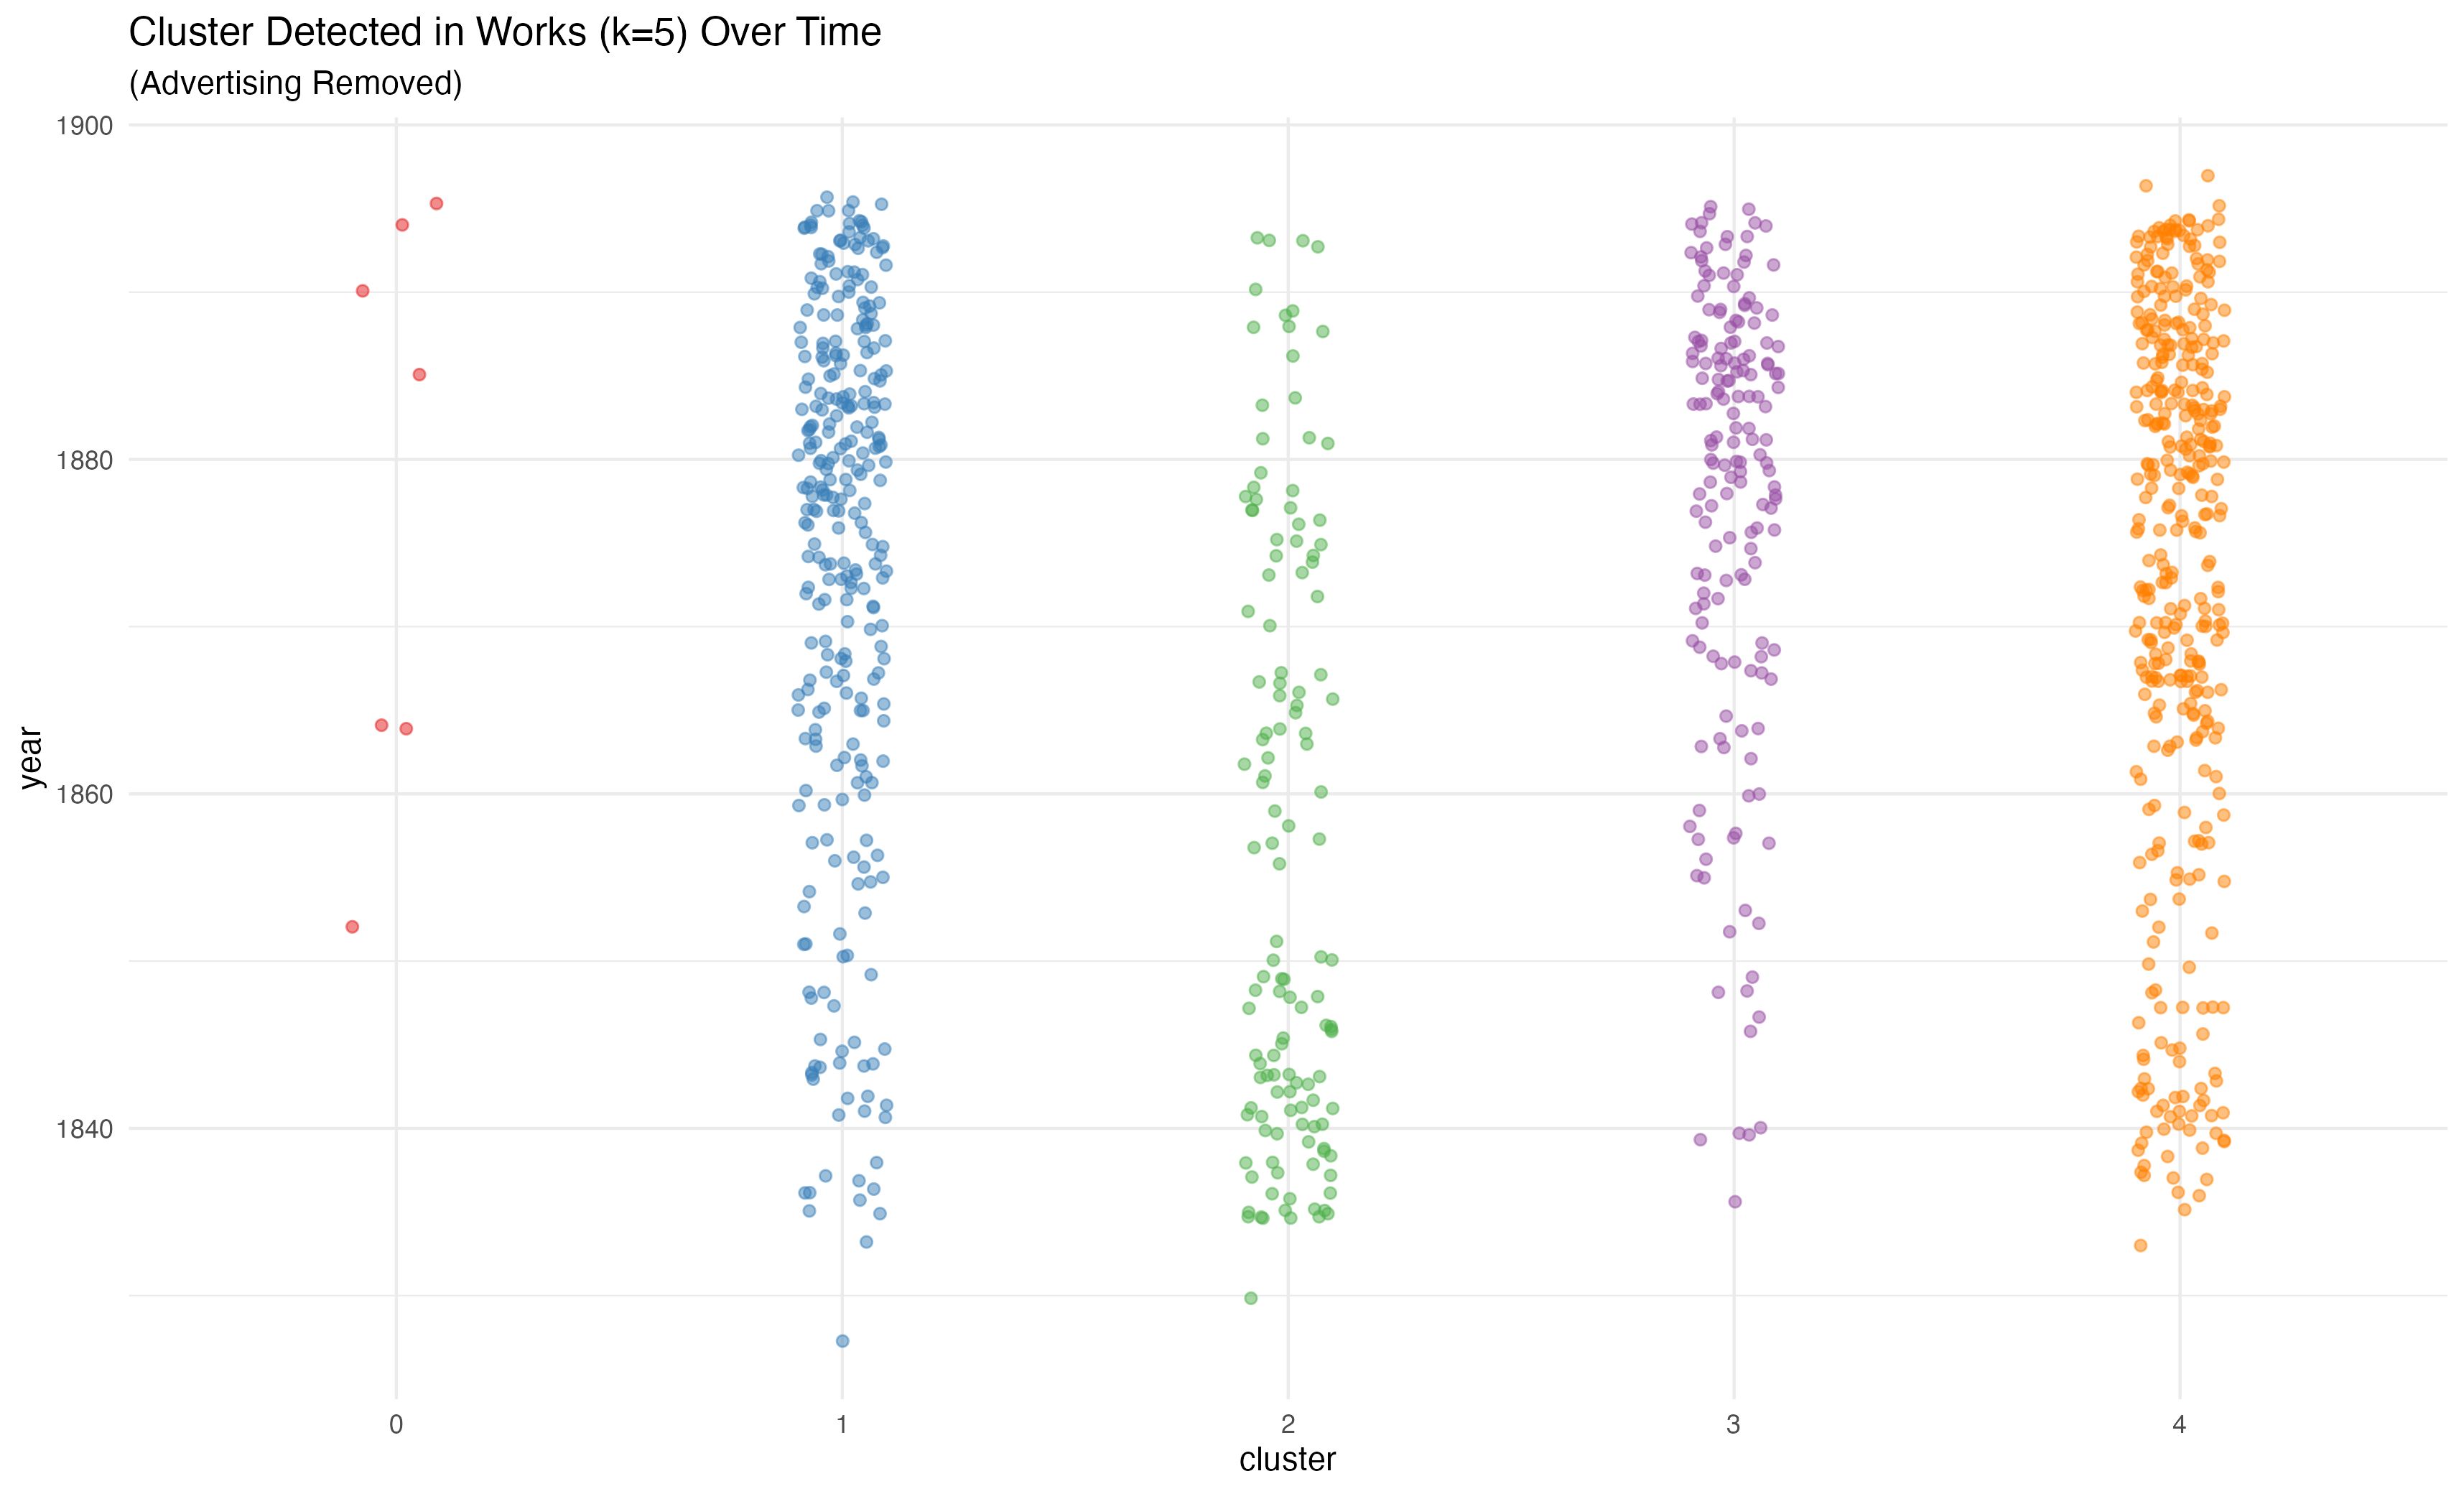
There would be other things to say about this new clustering. K-means clustering is a stochastic process, so one can’t compare separate clusterings directly. It is especially important to not see any of these clusters as directly corresponding to the old cluster 4. This is simply a new way of splitting up the ~1000 novels in this dataset. However, by removing the pages I identified as advertising we also eliminate the appearance of a cluster that emerges around 1880.
Advertisement in the Time of the Triple-Decker’s Decline
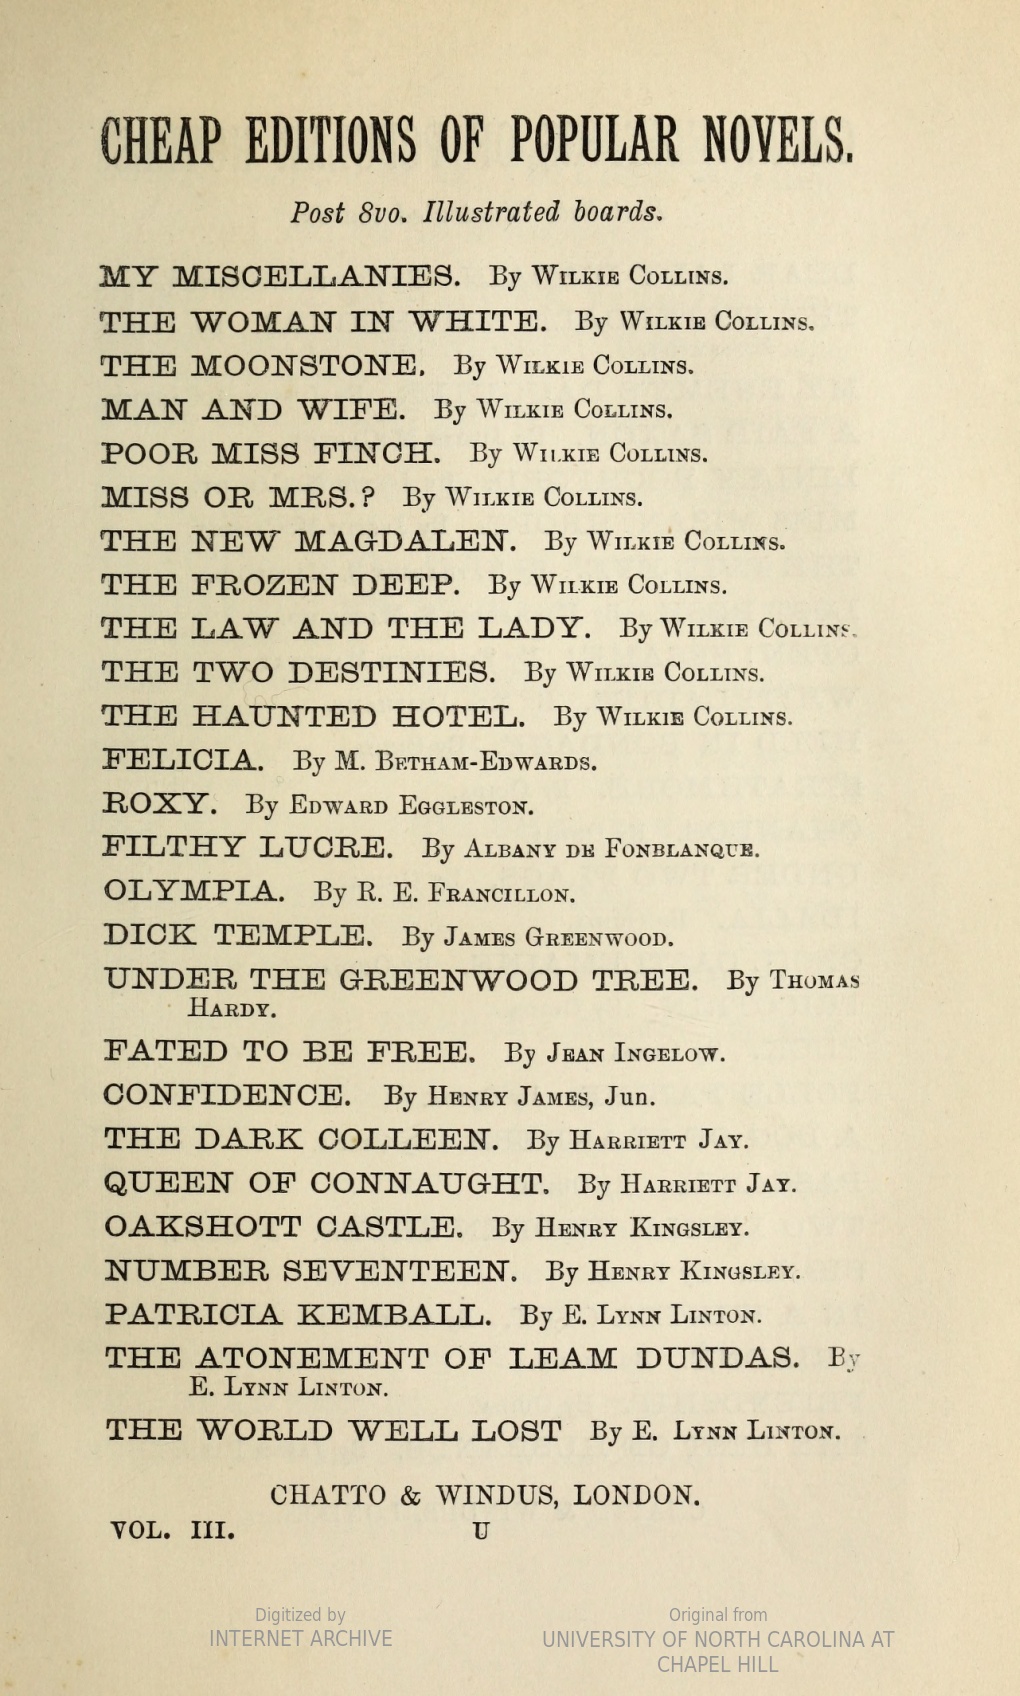
You may be wondering: what did these pages of advertisements look like? There is some range, but they are mostly book lists published by the publisher featuring “New Books” (or New Books this Month). They typically list author, title, and some short description of the book object itself (e.g. cloth, illustrated; sometimes a price). They could be quite simple, as this list of “Cheap Editions of Popular Novels.”
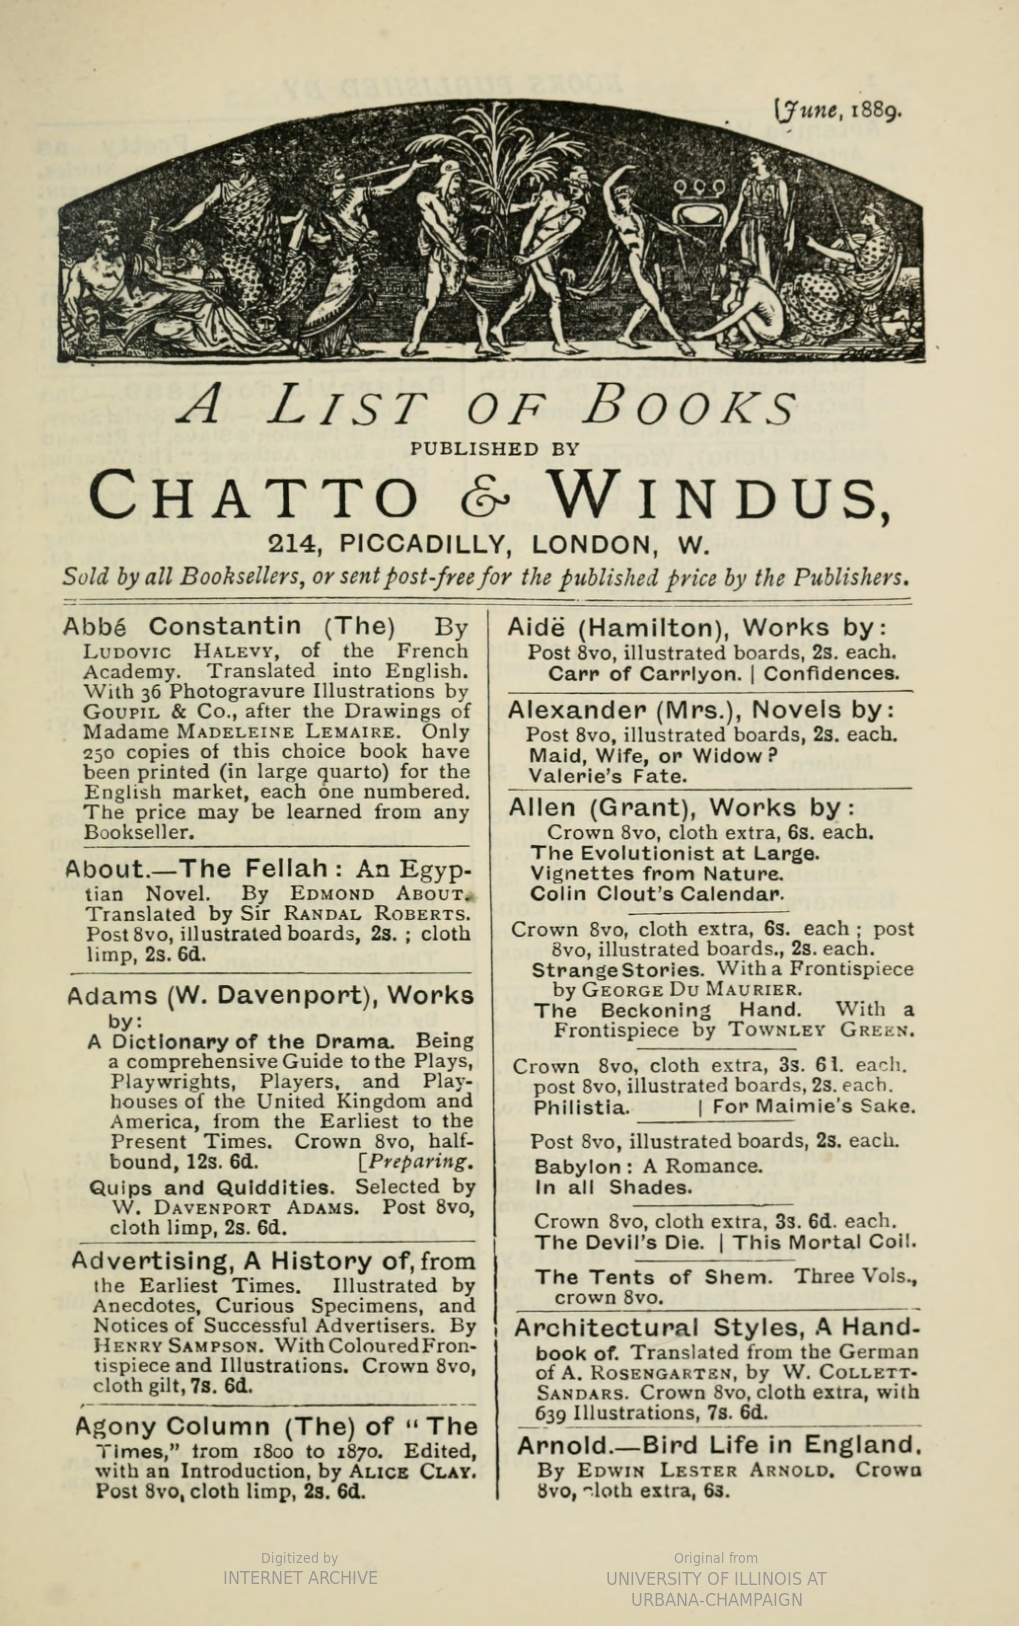
They could also be more elaborate, like this page—the first of a more than 30-page addendum listing Chatto and Windus titles.
At times an entire page would be devoted to a single work, as in this advertisement for the second volume of what I take to be a history of the Tower of London. It includes extensive quotations from reviews as well as a complete table of contents. The book list then continues for another sixteen pages of advertisements (most significantly shorter) after than this one.
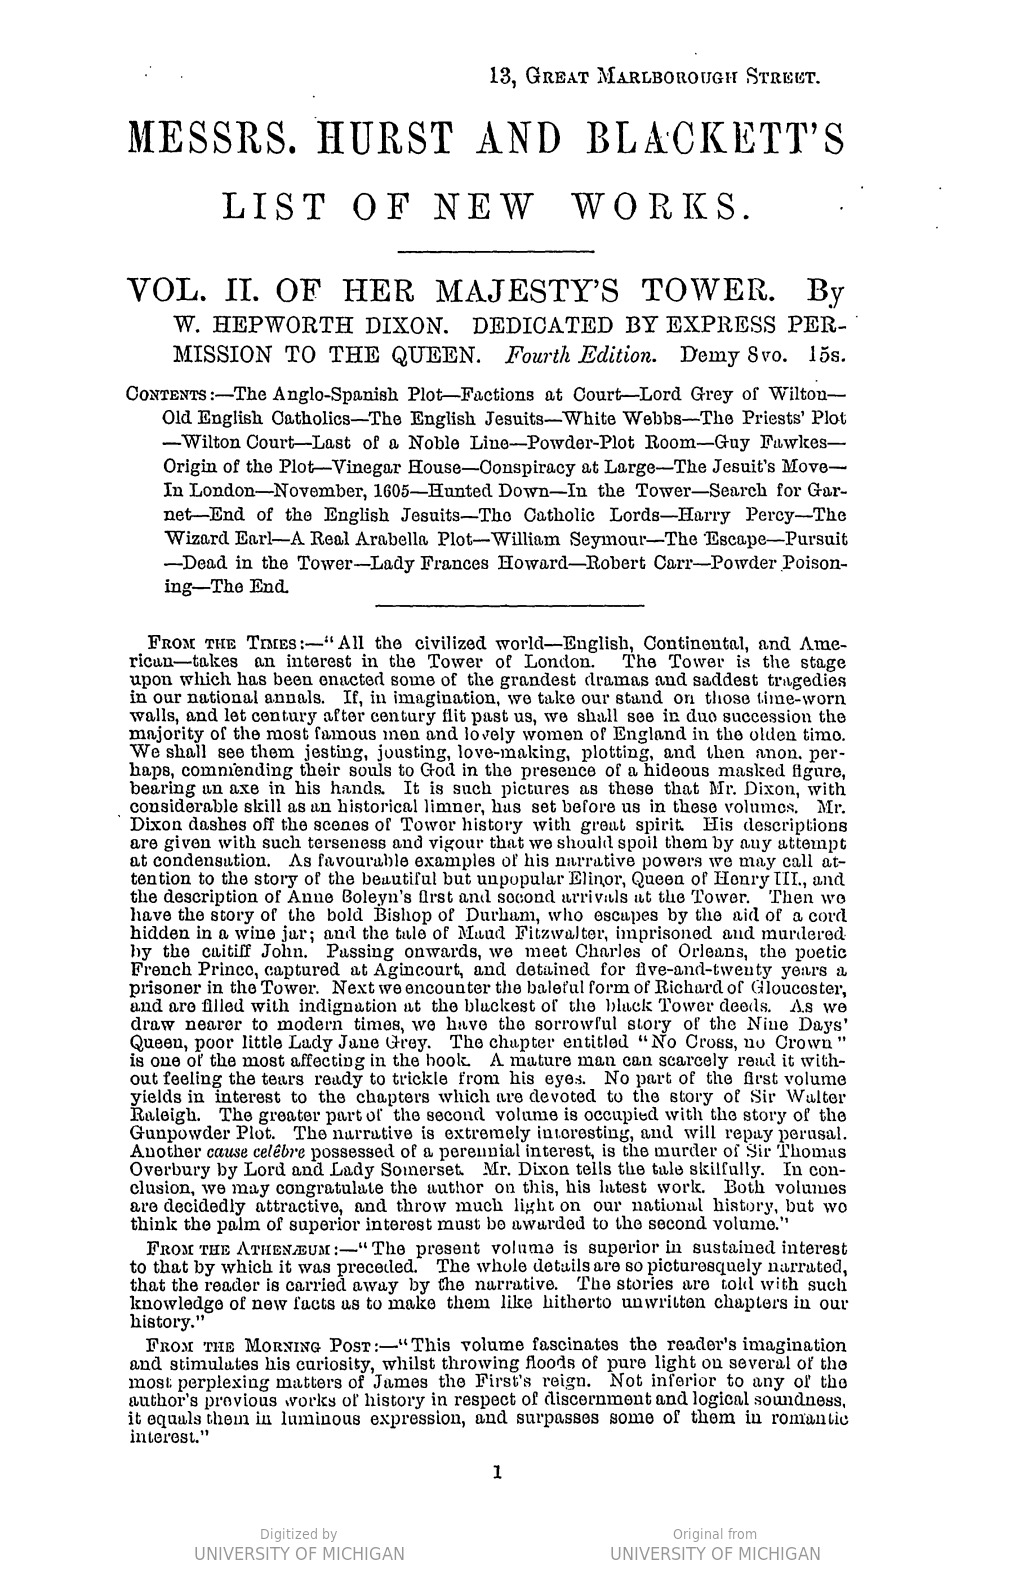
These lists advertize works in a variety of genres; they sometimes have their own pagination and were presumably added to many different novels as they were being published.
They are mostly advertisements of books for sale—rather than for lending from a private library. While in one list Chatto and Windus offers a short list of “New Novels at All Libraries,” most of these lists directly address consumers—offering works for sale (“Sold by booksellers, or sent post-free for the published price by the Publishers”) to readers at prices more reasonable (often in the 2–6 shillings range) than the three-volume novel’s inflated retail price of one and half guineas. It is interesting that these lists increase in the 1880s, as this is the period when the three-volume novel (and the market structure of lending libraries) were beginning to decline. These lists might be seen (either as cause or effect) of the decline of the three-volume novel’s dominance, which was inextricable from the subscription library model.
Concluding Methodological Reflection
This mystery emerged from a fluke in the data. But one’s man’s noise (“Can I cluster the genres of the three-volume novel?”) is another man’s signal (“Increasing advertisement lists index the waning of the business model of the three-volume model.”). I don’t know that this is a new insight about the period, the three-volume novel, or Victorian publishing, but the increase in advertising for its alternatives (cheaper, single volume novels) is certainly part of the picture of the three-volume novel’s decline.
It also ends up being a potentially valuable dataset of its own. Advertising lists contain information about price and genre; they highlight prominent reviewing journals. They could also point to titles not yet identified in ATCL or other bibliographies. The tendency one sees in even simple book lists, for instance, to identify novels by their authors seems an important and telling detail of how novels were marketed.
And, of course, identifying these pages allows them to be removed, which will in turn (I hope) improve results when I return to clustering these novels.
But if I am trying to talk up the benefits of this exploration of advertising lists in three-volume novels, it is mostly because of how laborious it has been. It is a cliché that 80% (at least!) of data analysis is data cleaning. But cleaning, as a metaphor, may obscure how demanding this work can be. The cleaning metaphor obscures, as in this case, that figuring out what was dirt and what was data was the challenge. Complex, historical datasets (like HathiTrust data) present these sort of unique challenges, where investigating even a banal question (did advertising increase in three-volume novels?) involves an enormous amount of care to avoid making mistakes.Which is not to discount the possibility that I have missed something!